The Complete Guide to Hangar Optimization
12 min read · Last updated March 7, 2026
Based on our analysis of layouts across 100+ FBO facilities, most are leaving 20-35% of their hangar capacity on the table. Not because the space isn't there, but because they're planning in two dimensions, leaning on tribal knowledge, and running clearance rules nobody has questioned in a decade.
This is what I've learned optimizing dozens of hangars: how to think about it, how to measure it, and what actually moves the revenue needle.
Table of Contents
- What Is Hangar Optimization?
- Why It Matters
- Calculating Hangar Capacity
- 3D Stacking
- The Role of SOPs
- Problem Aircraft
- Utilization Myths
- Equipment That Enables Better Stacking
- Measuring ROI
- Software Solutions
- Getting Started
- FAQ
What Is Hangar Optimization?
It's maximizing revenue per square foot while keeping aircraft safe, operations flowing, and customers happy. Not just cramming more jets in.
An optimized hangar balances three things:
- Capacity: maximum aircraft given your building, fleet mix, and clearance rules.
- Accessibility: any aircraft extracts with one move or fewer.
- Throughput: fast turns during peak periods, no bottlenecks at the door.
A hangar packed to 95% where every extraction requires a three-jet shuffle is not optimized. It's a liability. Your crew burns time, hangar rash risk spikes, and customers start calling the FBO down the road.
Why Hangar Optimization Matters
One additional overnight mid-size jet per week generates roughly $124,000 in annual revenue across fuel, ramp fees, handling, and ancillaries. For a large-cabin jet (G650, Global 7500), that number passes $600,000.
Every aircraft you turn away because "the hangar is full" has a price tag. And in most cases, the hangar isn't full. It's poorly arranged.
The gap between 65% and 85% utilization on a 40,000 sq ft hangar at $3/sq ft monthly: $288,000/year.
The difference between "full" and "poorly arranged" is often six figures per year.
Meanwhile, 71% of airports report hangar waiting lists. The U.S. business jet fleet has grown steadily for two decades, and manufacturers have thousands of deliveries on backlog through the early 2030s. New construction runs $100-$200/sq ft depending on region and build spec. You can't build your way out of this. You have to optimize what you've got.
Calculating Hangar Capacity
The most common mistake: dividing gross area by average aircraft footprint. That math ignores door corridors, columns, equipment zones, egress paths, and towing paths. A 30,000 sq ft hangar typically loses 2,000-4,000 sq ft to these before you park anything.
The right approach follows five steps:
Step 1: Measure usable area. Gross interior minus every no-park zone: columns, fire suppression, GPU stations, tool staging, door swing clearances.
Step 2: Define aircraft geometry. Wingspan, length, tail height for each type you handle. Then wrap each in a clearance envelope matching your SOP rules. A CJ4 with 2-foot lateral clearance has a different effective footprint than one with 3-foot clearance.
Step 3: Account for door constraints. The approach lane is not parking space. Factor in turning radius for your tug/towbar combo and the swing path of wingtips and tail.
Step 4: Test configurations. Aircraft aren't rectangles. A G550 nose-in next to a King Air 350 is a completely different problem than that G550 next to a Phenom 300.
Step 5: Validate extraction sequences. If the first departure requires moving four other jets, it's not a valid layout. Test every config against your departure schedule.
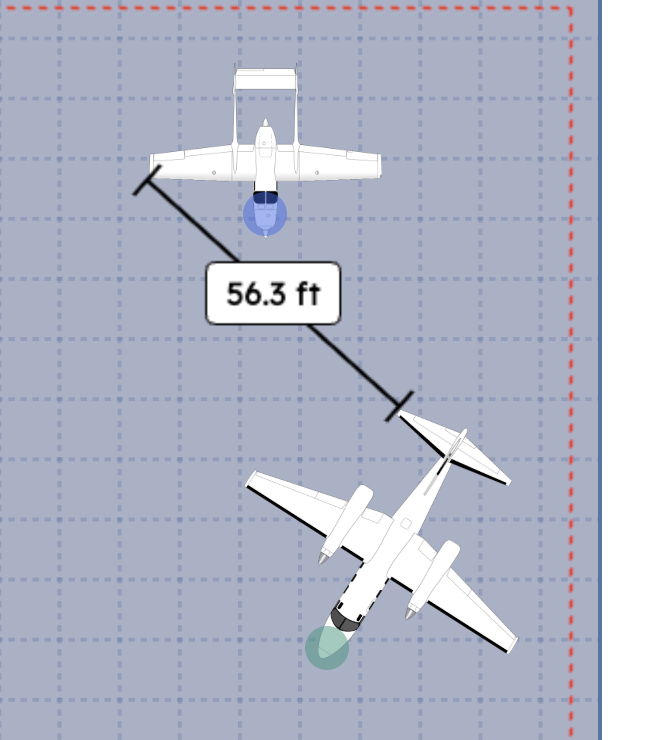
Precise measurement beats eyeballing it from across the hangar.
3D Stacking: Beyond Flat Floor Plans
Traditional planning treats the floor as a 2D parking lot. This misses the single biggest source of capacity gains: vertical overlap.
Business jets have wildly different height profiles. A Citation CJ4 stands 15.2 feet at the tail. A King Air 350 reaches 14.3 feet. A Gulfstream G650 tops out at 25.8 feet. In 2D, you treat them all as occupying the same vertical space. They don't.
A King Air's wing tucks under a taller jet's wing. A Phenom's nose slides under a Challenger's tail. These overlaps are invisible on flat floor plans.
These vertical overlaps unlock 15-25% more capacity on their own. Layer in SOP recalibration and tug upgrades, and the gains compound further.
The catch: vertical clearances are measured in inches. A wing-over-wing config with 4 inches to spare becomes a $500,000 winglet repair if someone bumps a tug lever. You need precise dimensions, real-time conflict detection, and a system that accounts for gear compression, tire pressure, and floor slope. The 3D stacking guide gets into the mechanics.
The Role of SOPs in Hangar Efficiency
Your clearance rules have an outsized impact on capacity. Most FBOs have never put a dollar figure on it.
We ran a controlled experiment: same 150'×200' hangar, same 18-aircraft fleet mix, six SOP configurations varying horizontal clearance (2', 2.5', 3') with and without vertical overlap. The conservative config (3' spacing, no overlap) hit 119% utilization. The optimized config (2' spacing, with overlap) hit 139% utilization, fitting 2-3 additional aircraft. The biggest lever wasn't spacing width, it was whether you allow strategic overlap (tucking a Citation's nose under a Challenger's tail). That alone added 15-20 percentage points.
Every extra 6 inches of clearance across 6-12 aircraft compounds into a full parking position you're leaving empty. At $900-$1,500/night for a midsize jet, those 2-3 extra positions add up fast.
This isn't about being reckless. A crew running a towbarless tug with centimeter precision can safely operate tighter than a crew with a diesel tug and 10-foot towbar. Match the SOP to your actual risk profile, not a blanket rule from a previous manager.
Problem Aircraft Configurations
Some aircraft eat far more space than their spec sheets suggest. If you're pricing them the same as well-behaved airframes, you're leaving money on the table.
Wide wingspans with low ground clearance. The Learjet 35/36 family. Wingtip fuel tanks extend the effective span, and the low wing blocks overlap with adjacent aircraft. The tip tanks add roughly 4 feet of effective wingspan and block wing-over-wing nesting with adjacent aircraft.
Tall tails on compact airframes. The G650ER stands 25.8 feet at the tail on a 99.7-foot fuselage. That tail creates a dead zone behind it where nothing can overlap vertically.
Swept wings. A G650 with 36 degrees of wing sweep traces a complex arc during turns. Crews get nervous, clearances widen, capacity drops.
Military and oversized. A C-17's 169.8-foot wingspan occupies your entire hangar width and forces a complete restack. Port City Air at KPSM knows this well: they sequenced 17 Italian Air Force aircraft (6 Eurofighter Typhoons, 6 F-35s, 3 tankers, 2 C-130s) across 120,000 sq ft. Director of FBO Operations Jamie McCarthy: "You hoped the person doing it had that Tetris mind."
Pusher props. The Piaggio Avanti's rear-mounted props and forward canard break every standard parking assumption. Prop arc behind the tail, canard conflicts at the nose.
Problem aircraft aren't just harder to park. They make everything around them harder to park too.
Hangar Utilization Myths
The biggest myth: capacity scales linearly with square footage. It doesn't.
We ran 48 controlled layout experiments, varying hangar dimensions in small increments while holding fleet mix, SOPs, and equipment constant. Capacity unlocks in steps, not smooth curves. A 140-foot-wide hangar holds 7 aircraft. Add 5 feet: nothing changes. Add another 5: suddenly an 8th position opens because you've crossed a geometric threshold where a specific wingspan plus clearance envelope fits the remaining gap.
Capacity jumps at thresholds. An architect designing from linear extrapolation will get the math wrong.
This wrecks construction planning. A 150-foot-wide hangar designed by extrapolating from 120 feet will hold fewer aircraft than predicted. And a 50,000 sq ft building with bad door placement can hold fewer revenue-generating jets per square foot than a smaller, better-proportioned facility.
Equipment That Enables Better Stacking
Your tug determines how tightly you can stack. We tested three scenarios in a 20,000 sq ft hangar with identical fleet mix (Citation VII, two G350s, Challenger 3500, CJ2, SF50, Cessna 207) and a $20,000/month revenue baseline at 100% utilization:
| Tug Type | Utilization | Monthly Revenue |
|---|---|---|
| Diesel tug, 10-ft towbar | 95% | $19,000 |
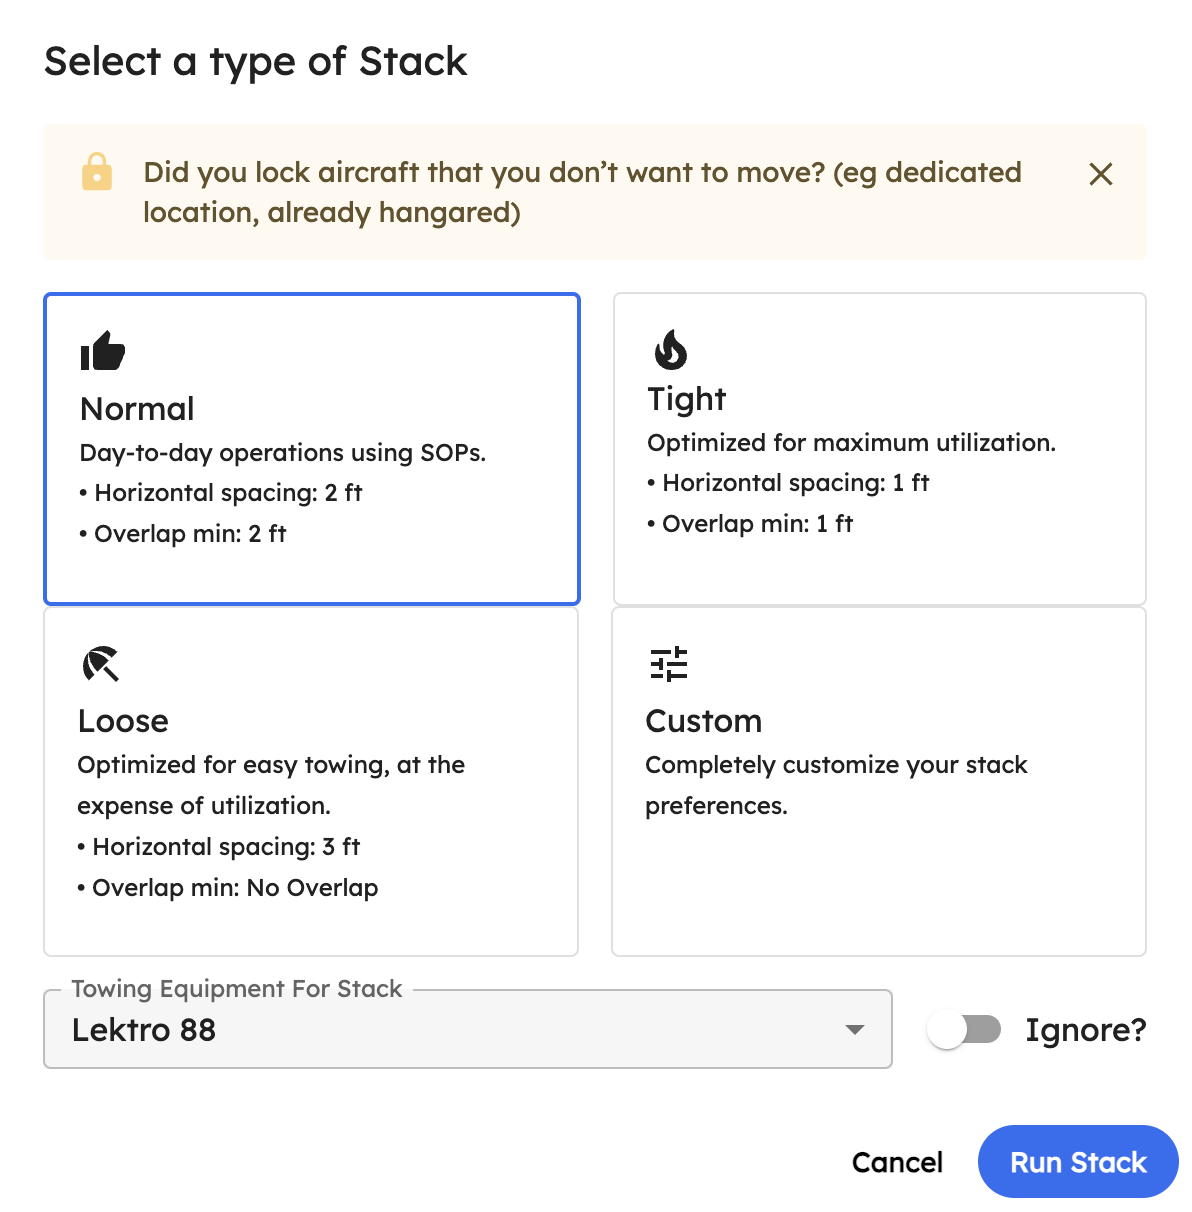
| Electric towbarless (LEKTRO 88) | 113% | $22,600 (+$3,600) |
| Remote-controlled electric | 125% | $25,000 (+$6,000) |
$72,000 in annual revenue difference between the worst and best tug in the same hangar. A towbarless electric like the LEKTRO 88 runs $110,000-$130,000; remote-controlled tugs like the Mototok run $75,000-$95,000.
Measuring ROI
Track four metrics:
Capacity gain. In our experiments, SOP recalibration alone drove a 20 percentage point utilization increase (119% to 139%), and tug upgrades added another 30% on top of diesel baselines. Combined with 3D stacking, total gains compound significantly.
Revenue increase. A 40,000 sq ft hangar going from 70% to 85% utilization at $3/sq ft monthly: $18,000/month, $216,000 annually. Real example: Jet Aviation Milwaukee runs a single 38,610 sq ft hangar at KMKE. GM Jon Zelie: "We tended to be conservative in our estimates." After switching from walk-the-floor planning to software, nightly revenue jumped 10%+. His ROI math: "If we fit two more airplanes in a night, we've paid for AirPlx for a year."
Jet MKE's single hangar at KMKE. Software finds configurations the team wouldn't have tried.
Labor efficiency. Manual stacking eats 3-5 hours daily at many FBOs, roughly $50,000/year in labor for a task that takes seconds with software.
Incident reduction. A single hangar rash on a large-cabin jet runs $100,000-$500,000. FBOs using software-enforced clearance rules and conflict detection consistently report significant reductions in hangar rash incidents, with some facilities eliminating them entirely.
Plug your own numbers into the ROI calculator or see the detailed analysis with worked examples.
Software Solutions
The tools that matter for hangar optimization boil down to four capabilities:
3D visualization. See your hangar as it actually is: columns, equipment zones, door clearances, full aircraft geometry. Flat floor plans hide the vertical dimension where most gains live.
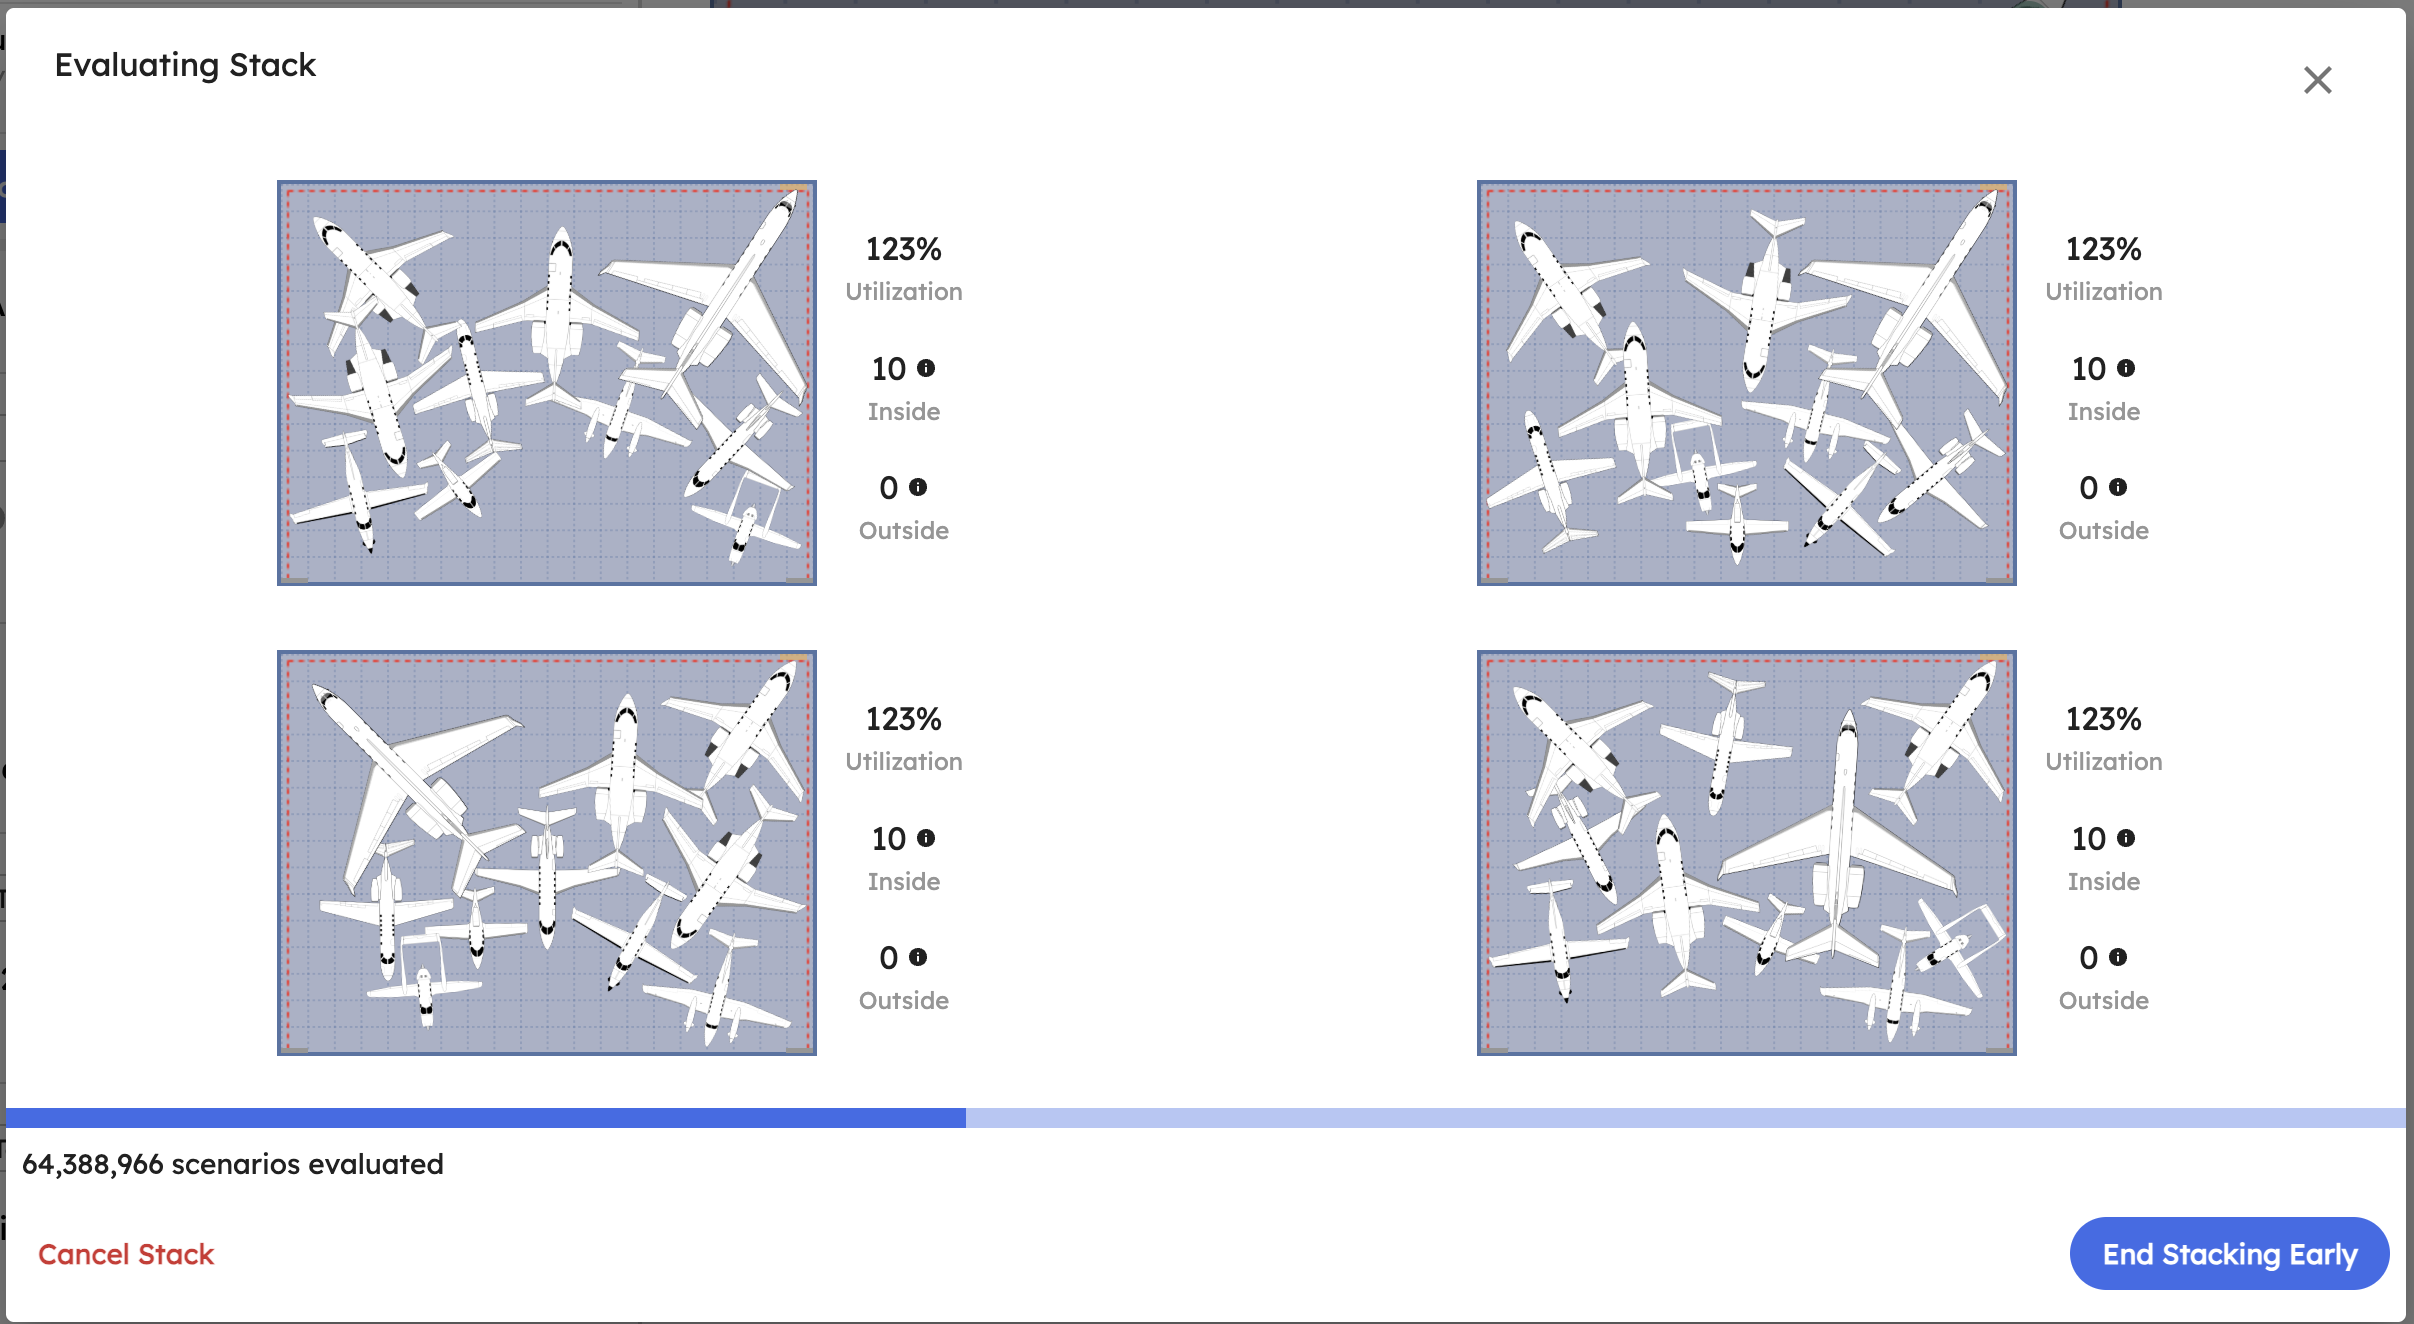
Automated layout generation. Instead of placing aircraft one at a time, the system evaluates thousands of configurations against your dimensions, clearance rules, towing paths, and departure schedule.
Conflict detection. Wing-over-wing, tail height, towing path, door clearance. Catches problems that experienced crews miss because it's working from precise measurements, not visual estimates from 40 feet away.
SOP enforcement. Every layout complies with your specific clearance rules. Consistent across every shift, every crew. When your best line supervisor calls in sick, the system still knows where every jet goes.
Want to see what it looks like with your actual hangar? Start here.
Getting Started
Not sure where to start? Here's a playbook for rolling this out:
Week 1: Audit. Measure actual utilization. Count aircraft turned away last month. Put a dollar figure on the lost revenue.
Week 2-3: Review SOPs. When were your clearance rules last updated? Run the numbers on what tighter clearances would unlock with your current equipment and crew.
Week 4: Evaluate equipment. Is your tug the bottleneck? Could a towbarless electric unlock positions your diesel can't reach?
Month 2: Implement software. Build a digital twin, load your fleet mix, run AutoStack. The ROI calculator projects the financial impact before you commit.
Month 3+: Iterate. Fleet mix shifts seasonally. New models enter the market. Crews get more comfortable with tighter configs. Treat this as an ongoing discipline, not a one-time project.
Frequently Asked Questions
How many aircraft can fit in a 30,000 sq ft hangar?
No universal answer. King Air 350s only: 8-10 with 2D, 11-12 with 3D stacking. G650s mixed with Citations: 4-6. In our 48 layout experiments, two hangars with identical square footage but different door placements differed by 3 positions.
What is the average hangar utilization rate?
It depends on how you measure. Most FBOs think they're at 80-90% because they're eyeballing floor coverage. But that's 2D math — it ignores vertical overlap entirely. When you measure total aircraft footprint against floor area (the way 3D stacking works), utilization routinely exceeds 100%. Our experiments hit 119-139% by tucking wings under fuselages and noses under tails — the highest we've ever seen is 176%. The gap between what most FBOs think is "full" and what's actually possible is where the revenue lives.
How much does hangar optimization increase revenue?
A 40,000 sq ft FBO improving from 68% to 85% typically sees $150,000-$350,000 in additional annual revenue. Premium markets can exceed $500,000.
What is 3D aircraft stacking?
Optimizing the full cubic volume instead of just floor area. Low wings tuck under high fuselages, noses slide under tails. These overlaps unlock 15-25% extra capacity alone, with further gains when combined with SOP and equipment changes.
What software do FBOs use for hangar planning?
Most still use whiteboards, magnetic cutouts, or spreadsheets. These can't model 3D conflicts or enforce SOPs automatically. The FBOs pulling ahead on revenue per square foot use purpose-built hangar stacking software with 3D visualization, automated layout generation, and real-time conflict detection.
How long does it take to implement hangar optimization software?
1-2 weeks to go live. Some FBOs see positive ROI within the first 3 uses by fitting 1-2 extra aircraft per night. Get started here.
Do I need to change my SOPs to benefit from optimization software?
No. The software works within whatever clearance rules you set. But it makes it easy to test tradeoffs: in our experiments, half a foot less clearance across 12 aircraft freed up space for one more King Air.