Complete Guide to 3D Aircraft Stacking: Turn Your Hangar Into a Revenue Machine
Published on April 14, 2025 • 7 min read
Picture this: It's 2 AM at Denver Centennial Airport. A severe hailstorm warning just came through, and you've got $45 million worth of aircraft sitting on the ramp. Six jets need immediate shelter – a Citation X, two King Airs, a Phenom 300, and two TBM 960s. Your night shift crew has 30 minutes before the storm hits. Traditional "eyeball" positioning could mean leaving at least two aircraft exposed to potentially catastrophic damage.
Industry figures in 2024 place hangar rash damages at about $150 million annually for business aircraft—and up to $3 billion when considering the full aviation ecosystem (and many incidents go unreported). Meanwhile, the average hangar operates at only 65% of its theoretical capacity. Most facilities waste 30-40% of their cubic volume simply because we're still thinking in 2D when we should be thinking in 3D. Walk into any FBO and you'll see it – aircraft parked with their wings at vastly different heights, yet positioned as if they're all occupying the same vertical plane.
What is 3D Aircraft Stacking?
Instead of treating your hangar floor like a parking lot, 3D stacking optimizes the entire cubic volume of your hangar. Modern hangar stacking software makes this optimization accessible to FBOs of all sizes. The concept builds on what experienced line personnel already know: aircraft have different heights and footprints that can complement each other when positioned strategically.
The Hidden Cost of Manual Planning: A 2024 industry survey found that FBOs spend an average of 2.3 moves to extract one aircraft during peak hours. At $150-200 per tug operation (including labor, equipment wear, and insurance liability), those unnecessary movements add up to $50,000-75,000 annually for a mid-sized facility. More critically, each movement increases hangar rash risk by 8%, according to insurance actuarial data. (Learn more about calculating your hangar's ROI potential)
Modern 3D stacking leverages cutting-edge technology to transform hangar operations:
- AI-Powered Optimization: Machine learning algorithms analyze historical movement patterns to predict optimal configurations
- Digital Twin Technology: Create virtual replicas of your hangar to test configurations before moving a single aircraft
- Automated Clearance Calculations: Real-time safety margin computation based on aircraft specifications and environmental conditions
- Smart Access Path Planning: Dynamic routing that considers departure schedules, maintenance windows, and crew availability
- Integration with Robotic Towing: Emerging autonomous towing systems can execute stacking plans with millimeter precision
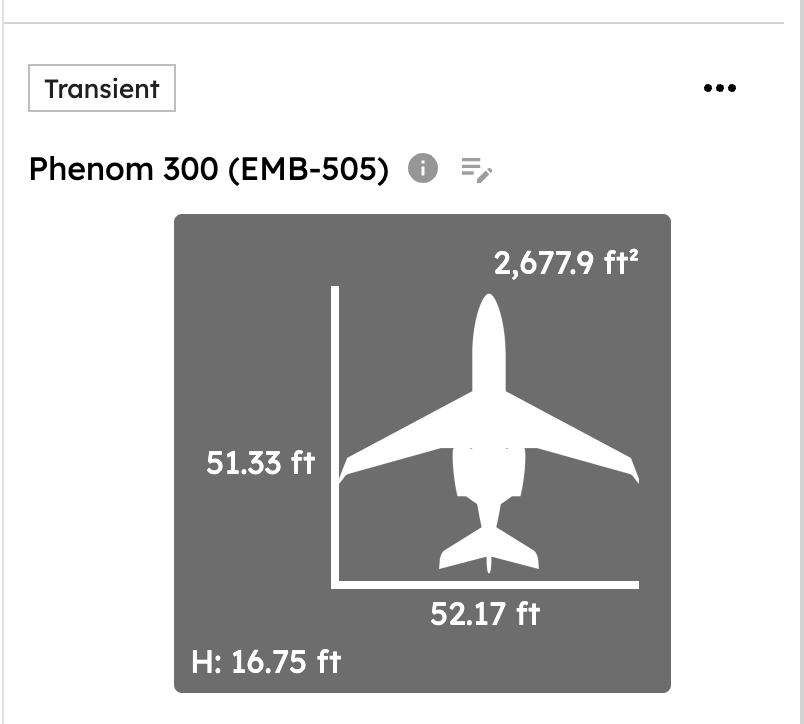 AirPlx's aircraft dimensions database includes over 500 models with precise measurements for optimal stacking calculations
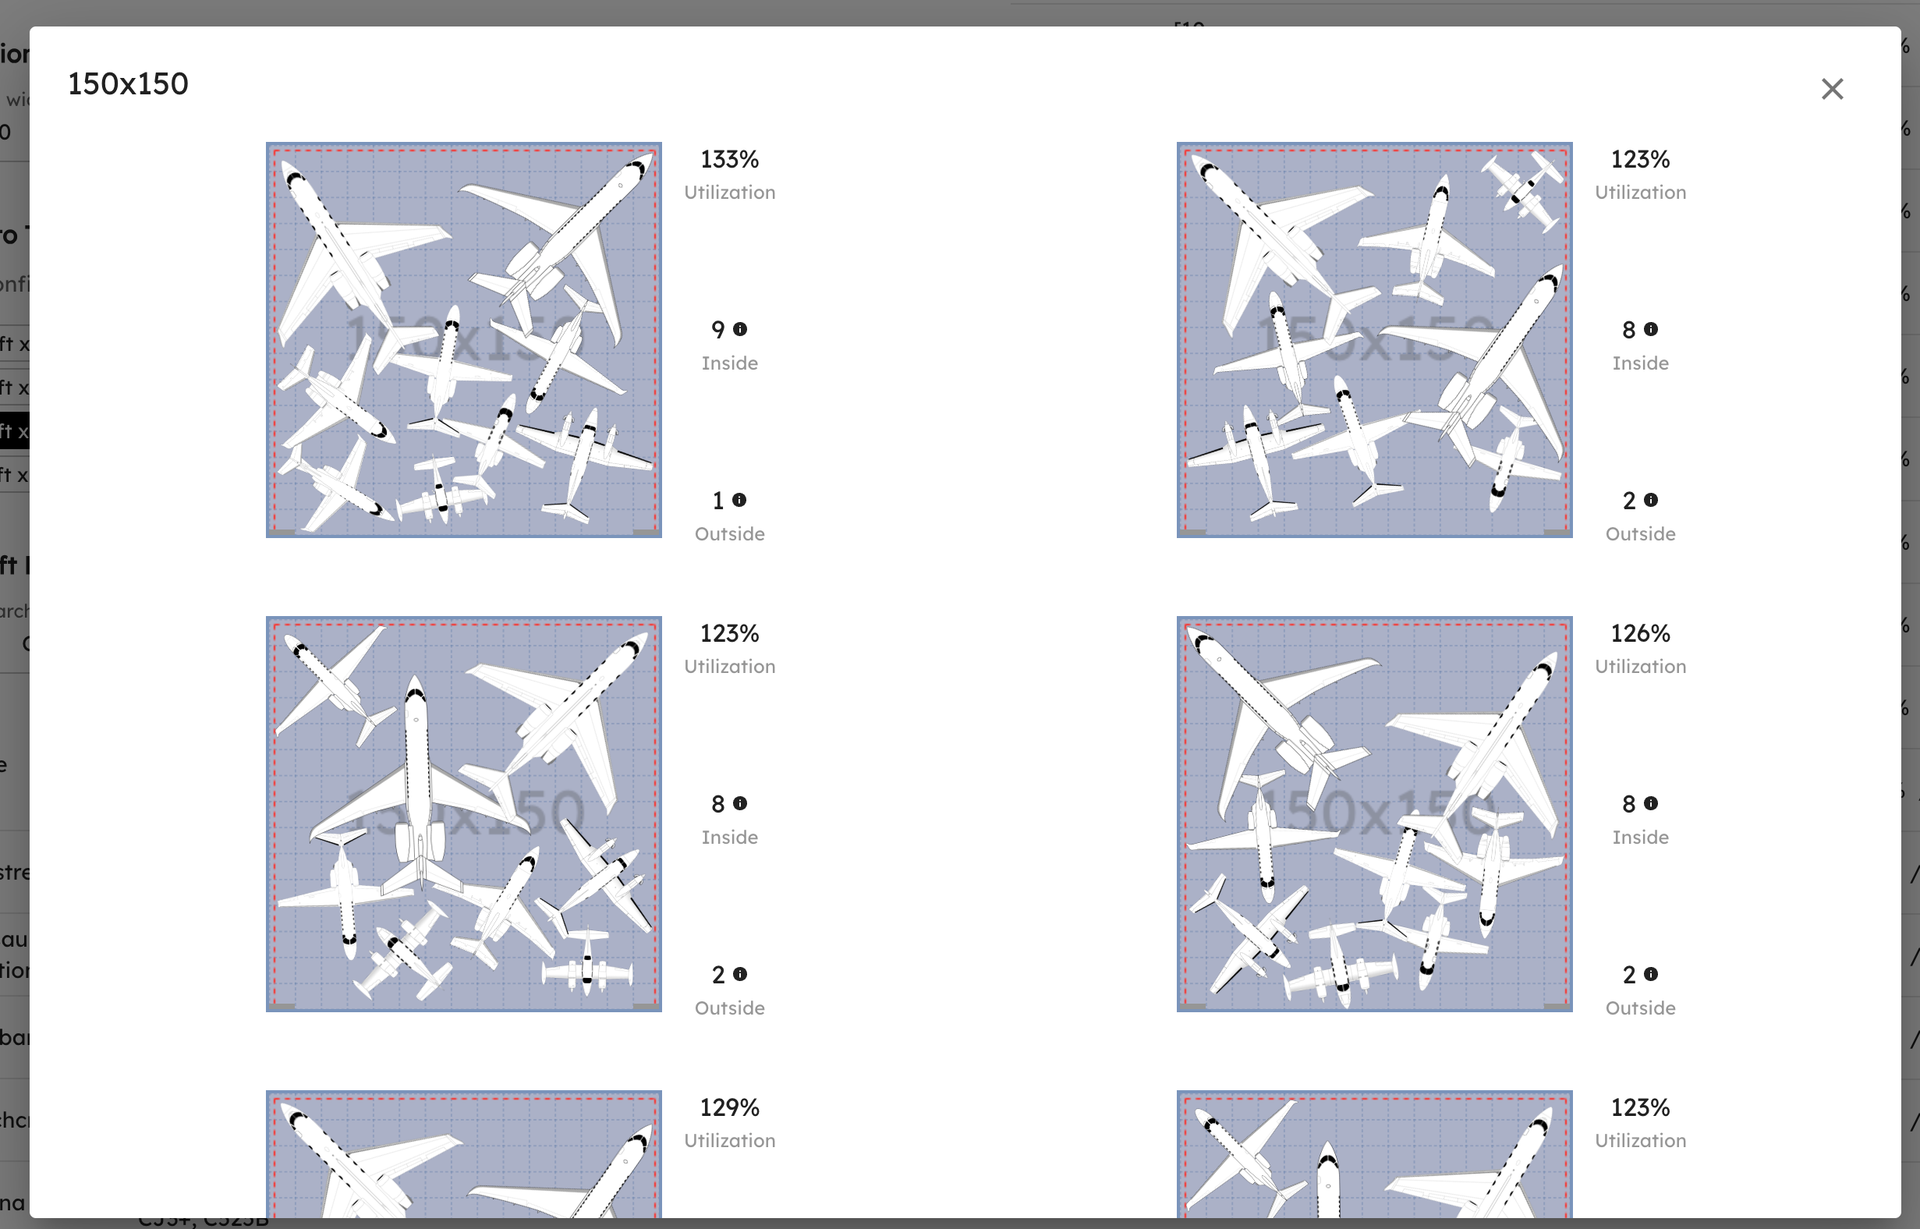
See how many aircraft fit in your hangar
AirPlx calculates optimized 3D stacking layouts for your exact hangar dimensions.
Run a free layout simulationKey Benefits of 3D Stacking
Increased Capacity and Revenue
According to 2024 industry data, FBOs implementing systematic 3D stacking achieve remarkable financial results:
- Average capacity increase: 35-42% within the first year
- Revenue impact: $12,000-$35,000 additional monthly revenue per 40,000 sq ft hangar
- Current market rates: $3-8 per square foot monthly (up from $2-6 in 2023 due to increased demand)
Success Story - Atlantic Aviation at LAX: After implementing 3D stacking in their 60,000 sq ft main hangar, they increased capacity from 12 to 19 large-cabin jets. With premium LA rates averaging $7.50/sq ft, this generated an additional $450,000 annually – while actually improving their safety record by 23%.
Reduced Aircraft Repositioning
The numbers tell a compelling story about operational efficiency:
- Industry average: 2.3 aircraft moves to extract one plane (traditional layout)
- With 3D stacking: 0.9 moves per extraction (61% reduction)
- Time savings: 22 minutes average per departure
- Labor cost reduction: $75,000-$125,000 annually for busy FBOs
- Hangar rash reduction: 52% fewer ground incidents reported
Improved Weather Response
Weather-related hangar demand spikes are where 3D stacking truly shines. (Proper hurricane season preparation combined with 3D stacking can be a game-changer):
- Storm capacity increase: Shelter 40-50% more aircraft during weather events
- Response time: Deploy optimal configurations in under 10 minutes
- Revenue opportunity: Capture $800-1,200 per night premium storm rates
- Customer loyalty: 87% of transients sheltered during storms become repeat customers
Enhanced Safety and Liability Management
The financial impact of hangar rash extends far beyond repair costs:
- Annual industry cost: $150 million to $3 billion (including unreported incidents)
- Average claim: $47,000 per incident (up 18% from 2023)
- Insurance premium impact: 15-25% increase after just two claims
- Customer retention: 68% of customers leave after experiencing hangar rash
The Technology Advantage: FBOs using AI-powered 3D stacking report:
- 73% reduction in ground incidents
- $180,000 average annual insurance savings
- 94% customer retention rate (vs. 82% industry average)
- Zero fatalities or serious injuries (critical for OSHA compliance)
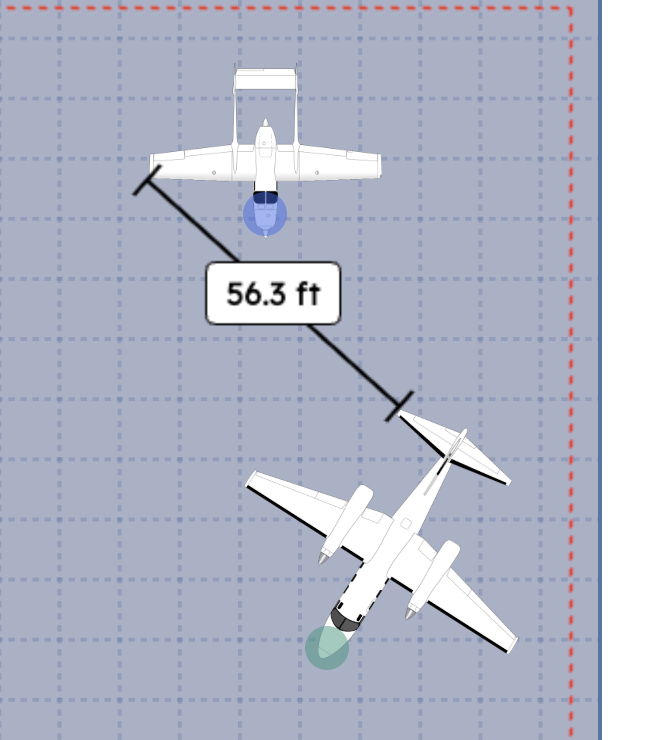 Digital measuring tools eliminate guesswork, providing real-time clearance calculations that prevent costly hangar rash incidents
Implementation Considerations
Operational Realities You Must Address
Ground Support Equipment (GSE) Requirements: Your existing tugs, towbars, and ground power units must physically fit between stacked aircraft. A Gulfstream positioned over a King Air looks great on screen, but if your tug can't navigate the clearance, the plan fails. (Choosing the right tugs for stacking operations is critical to success.) Factor in:
- Adequate clearance for aircraft tugs (typically 8+ feet)
- Wing walker positioning requirements
- Ground power and air start unit access
- Fuel truck maneuvering space
Staffing and Training Implications: Let's be honest – your veteran line chief who's been moving aircraft for 20 years might roll their eyes at "some computer telling them how to do their job." That's natural. But here's what changes their mind: when that same computer prevents them from working a 16-hour shift during a blizzard because it optimized the hangar in advance. Budget for:
- Initial training on positioning software (40-80 hours)
- Safety procedure updates and certification
- Increased supervision during the first 3-6 months
- Higher insurance premiums during transition period
Infrastructure Limitations: Before implementing 3D stacking, audit your hangar's physical constraints:
- Floor loading capacity (many older hangars can't handle concentrated loads)
- Electrical system placement (outlets, lighting that may interfere with stacking)
- Fire suppression system coverage with altered aircraft positioning
- HVAC considerations for different aircraft heights
Aircraft Compatibility and Regulatory Compliance
Not all aircraft combinations work safely together. Critical factors include:
Physical Constraints:
- Wing height and span compatibility (minimum 10-foot clearance required)
- Engine intake protection (jet wash and FOD considerations)
- Propeller clearance for turboprops
- Antenna and equipment protrusions
Operational Constraints:
- Access frequency (high-departure-rate aircraft need perimeter positioning)
- Customer service requirements (some operators prohibit stacking their aircraft)
- Maintenance access needs
- Emergency evacuation routes (must comply with local fire codes)
Insurance and Liability Considerations: Many FBO insurance policies have specific clauses about aircraft positioning and liability limits. Before implementing 3D stacking:
- Review your current policy for stacking restrictions
- Understand liability limits for aircraft-to-aircraft damage
- Consider additional coverage for hangar rash incidents
- Document your safety procedures for insurance compliance
Technology Requirements
Effective 3D stacking requires more than just visualization software:
Essential Software Features:
- Precise aircraft dimension database (500+ models minimum)
- Real-time inventory tracking integration
- Safety clearance calculations with regulatory compliance
- Access path optimization algorithms
- Customer billing integration for space-based pricing
Integration Requirements:
- Connection to existing FBO management systems
- Real-time aircraft tracking (arrival/departure scheduling)
- Billing system integration for space-based pricing
- Mobile access for line personnel
- Backup systems for critical operations
Best Practices for 3D Stacking
Following proven hangar optimization best practices is essential for successful implementation.
1. Start with Operational Assessment, Not Technology
Here's a truth bomb: software won't fix broken processes. Before you spend a penny on technology, take a hard look at your current operations:
- Track aircraft movement patterns for 30 days
- Document current hangar utilization rates by hour/day
- Identify peak demand periods and bottlenecks
- Calculate current repositioning costs (labor hours × hourly rate)
- Survey customer satisfaction with current access times
2. Implement Gradually with Pilot Programs
Successful FBOs don't implement 3D stacking across all operations simultaneously. Start with:
- One hangar during off-peak hours
- Low-complexity aircraft combinations
- Experienced line personnel as early adopters
- Extensive safety protocols and supervision
- Customer communication about potential changes
3. Prioritize Safety Over Capacity
While 40% capacity increases are possible, prioritize safety margins:
- Maintain 20% larger clearances than software minimums
- Always use wing walkers for stacked aircraft movements
- Implement mandatory safety briefings for each new configuration
- Create emergency response procedures for stacked aircraft scenarios
4. Account for Customer Service Impact
Some customers will resist having their aircraft stacked under others. Develop policies for:
- Premium customers who require isolated positioning
- Insurance restrictions on specific aircraft types
- Maintenance access requirements
- Customer notification procedures for positioning changes
5. Plan for Real-World Constraints
Weather Considerations: Remember that nightmare scenario when ice turned your ramp into a skating rink and it took three hours to move one King Air? Your stacking plans must account for:
- Reduced crew mobility in adverse conditions
- Increased aircraft movement time
- Emergency shelter priorities
- De-icing access requirements
Maintenance Integration: Scheduled maintenance affects stacking optimization. Consider:
- Maintenance hangar access requirements
- Parts delivery and equipment access
- Inspection schedules and regulatory compliance
- Work platform and lighting needs
6. Develop Performance Metrics That Matter
Financial Metrics:
- Revenue per cubic foot (not just square foot)
- Average repositioning cost per aircraft
- Customer retention rates for stacked vs. non-stacked aircraft
- Labor cost per aircraft movement
Operational Metrics:
- Average aircraft access time
- Repositioning frequency
- Hangar rash incident rates
- Customer satisfaction scores
- Staff efficiency and overtime hours
ROI and Performance Metrics
Financial Impact Analysis (2024 Market Data)
Revenue Potential (Updated 2024 Rates):
- 35% capacity increase on 40,000 sq ft at $3-8/sq ft monthly = $14,400-$38,400/month additional revenue
- Annual additional revenue: $172,800-$460,800
- Storm shelter premium revenue: $25,000-$75,000 annually
- Reduced labor costs: $75,000-$125,000 saved annually
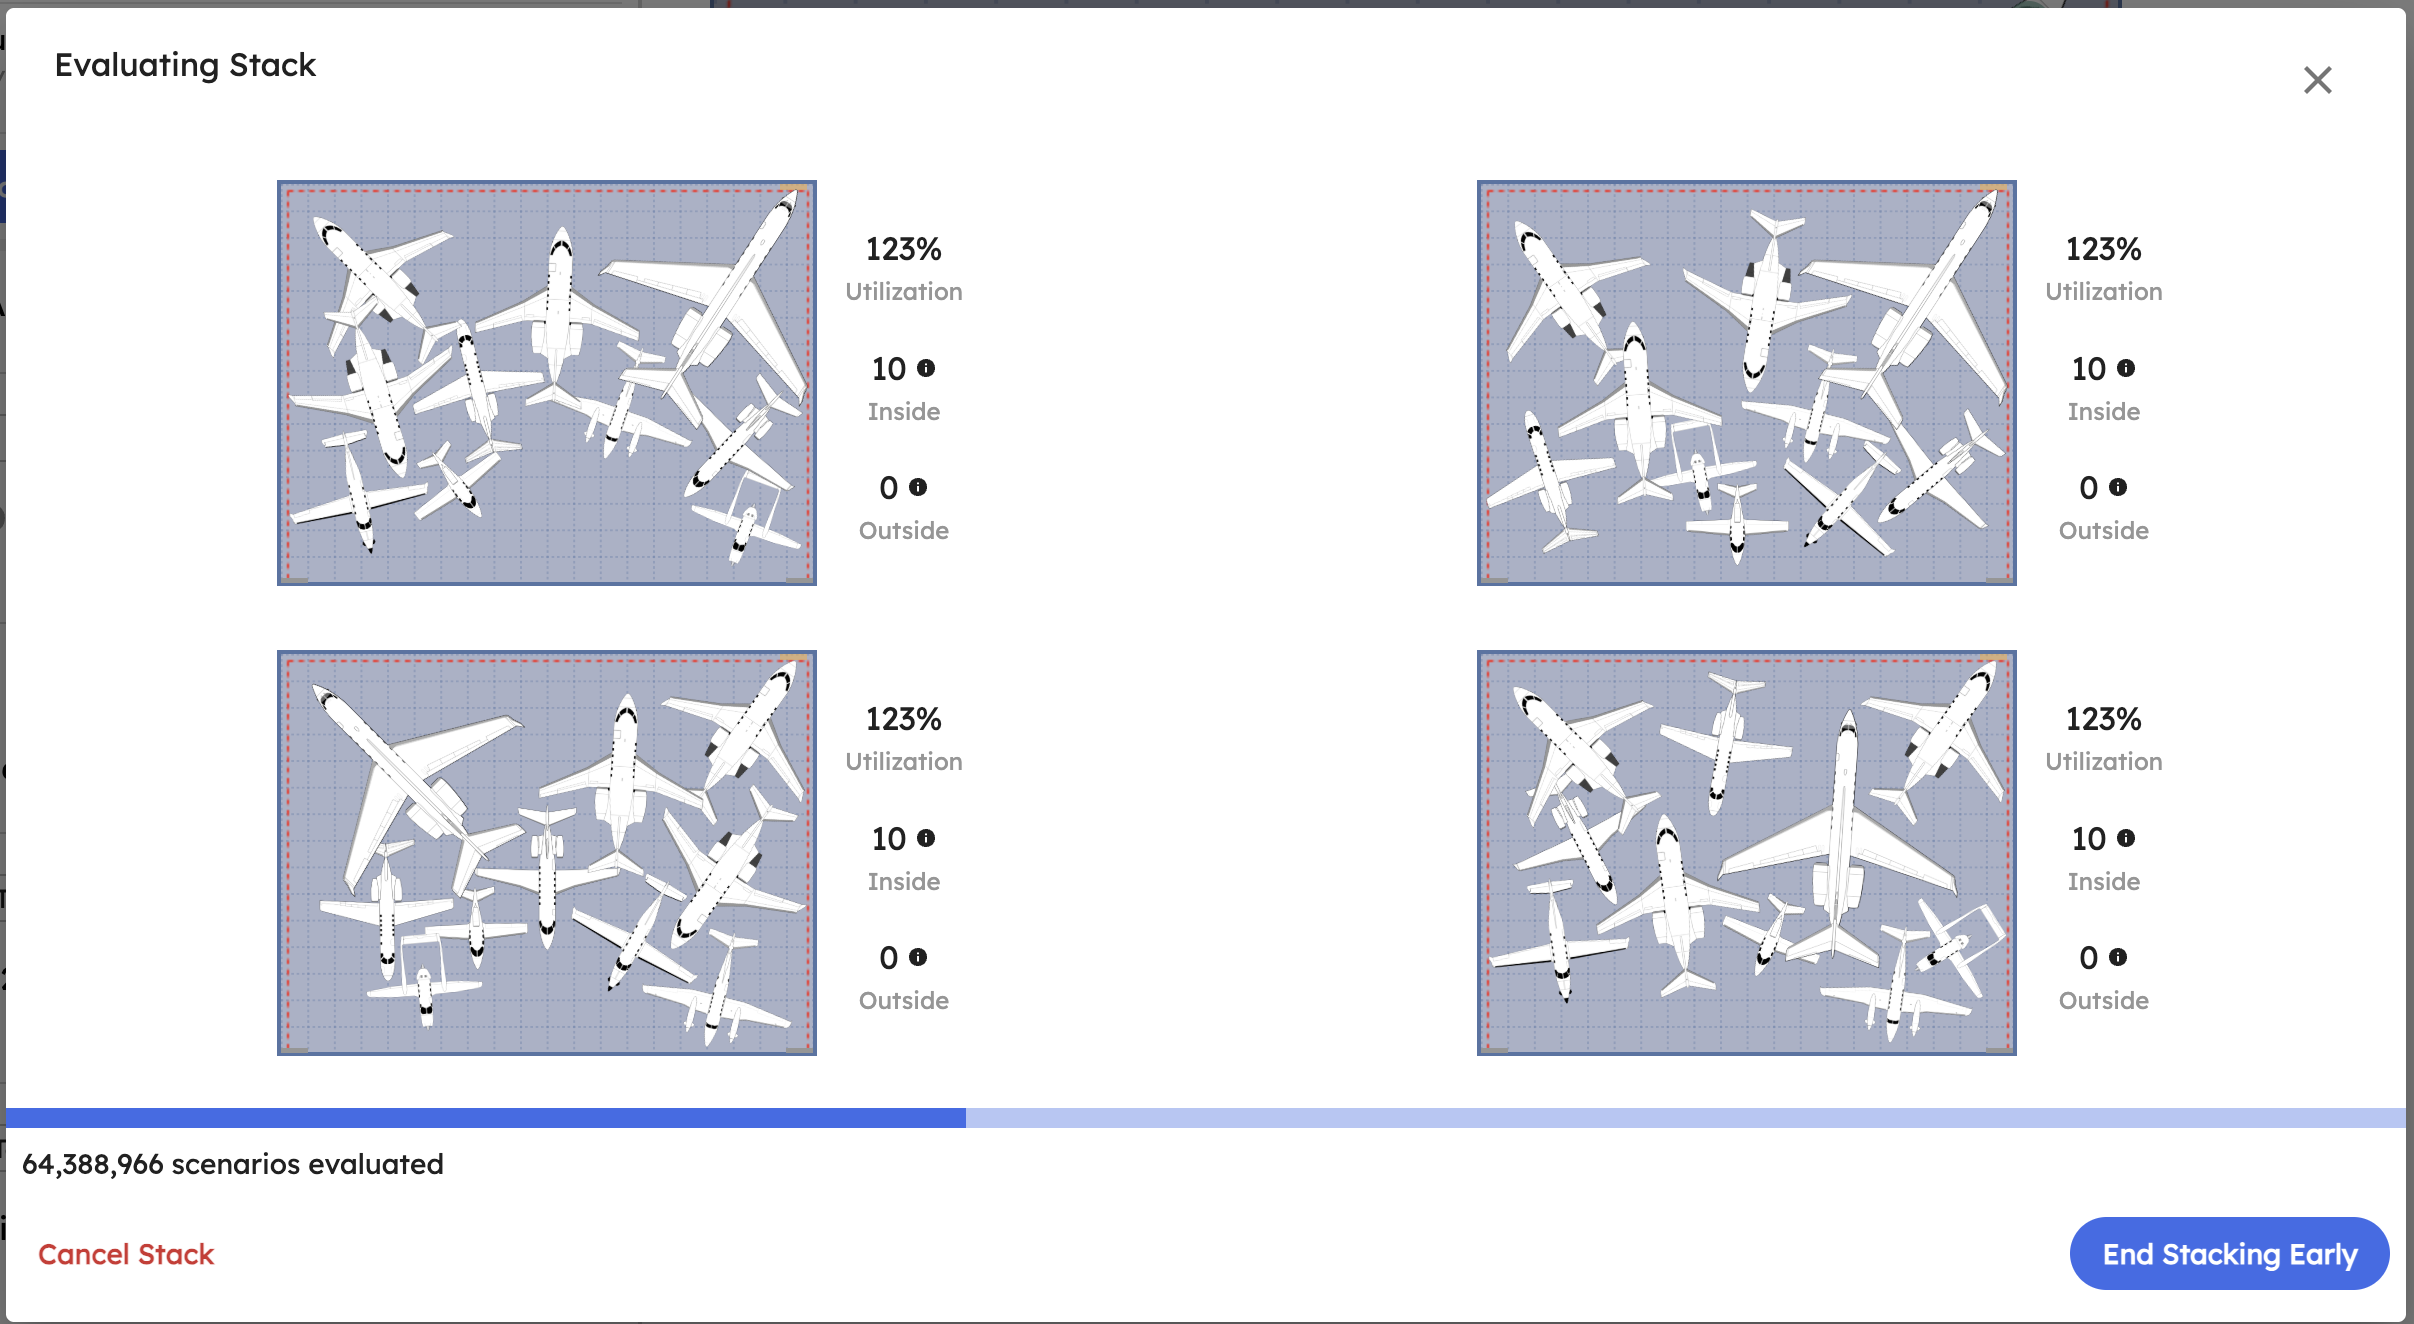
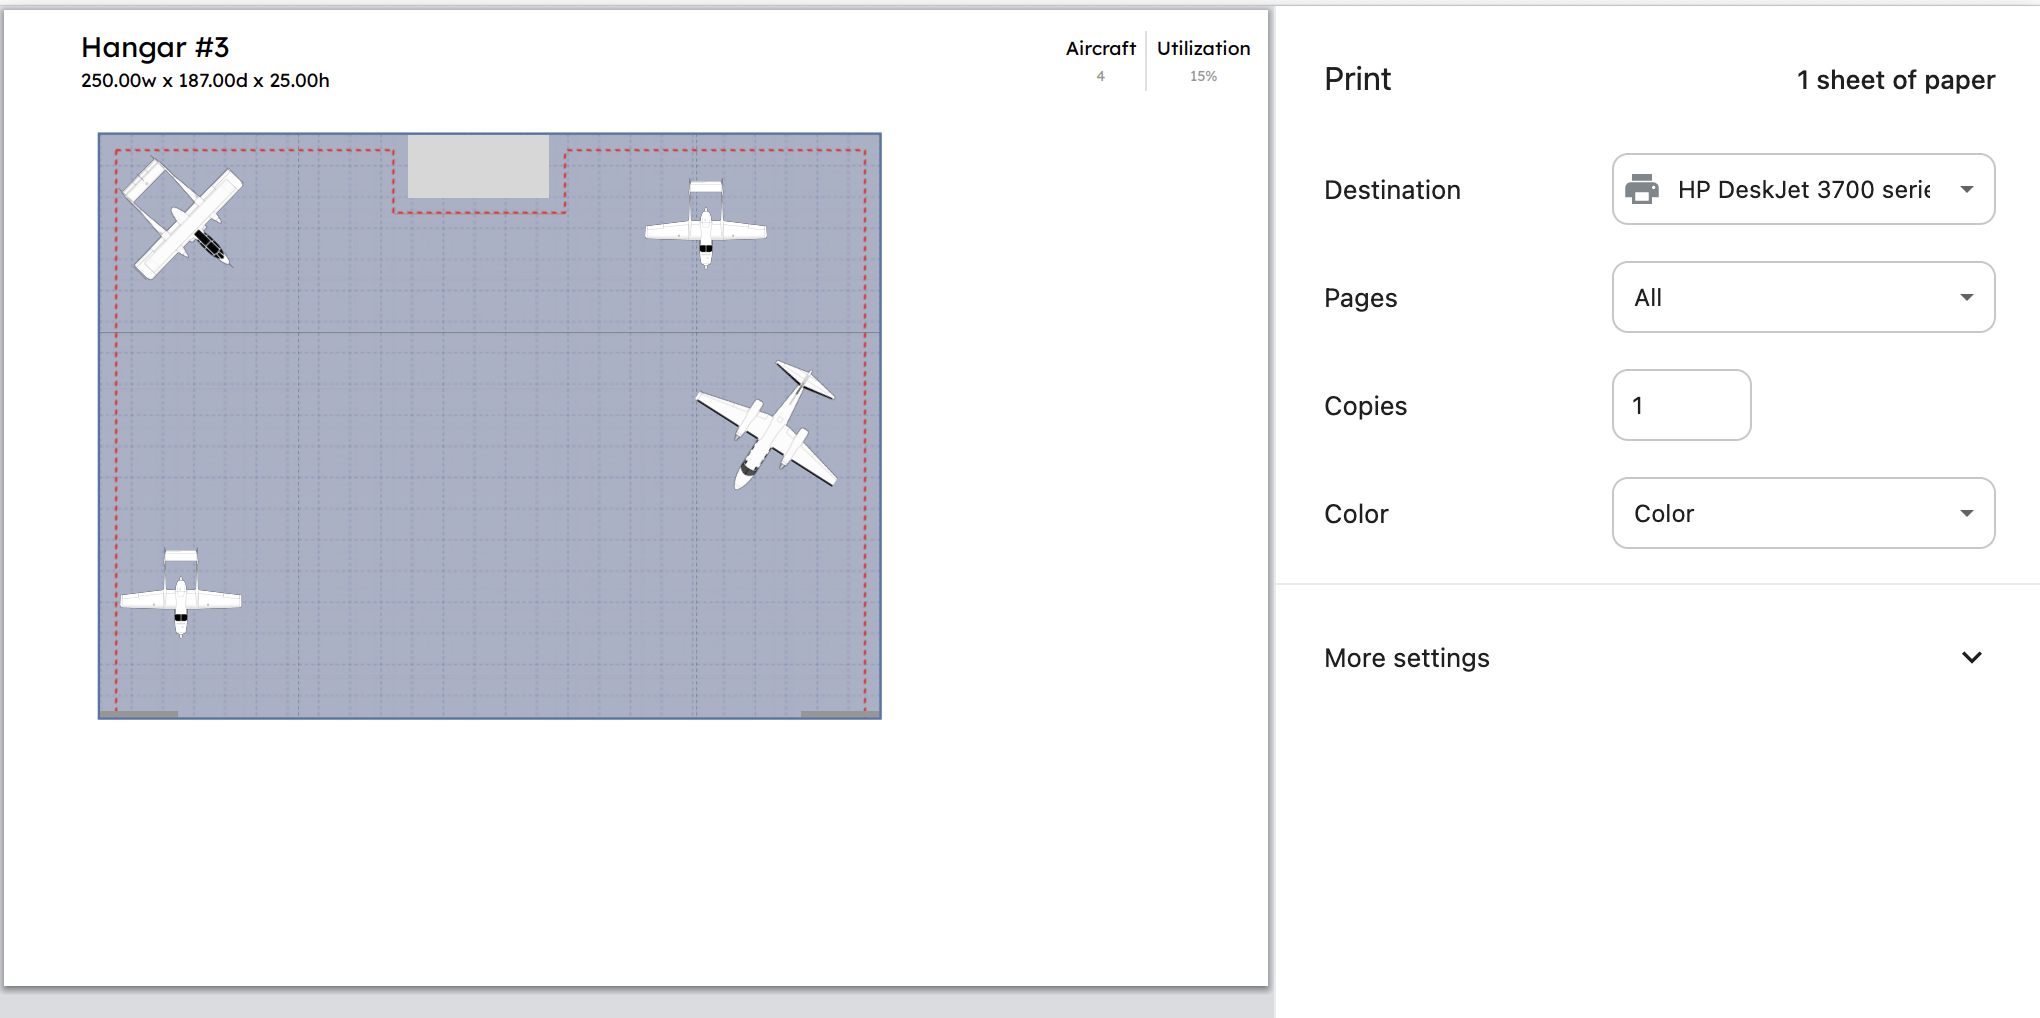 Visualize your optimized hangar layout before moving a single aircraft – reduce risk and maximize space utilization
Key Performance Indicators
Operational Efficiency:
- Capacity utilization: Target 85% (vs. typical hangar utilization rates)
- Aircraft repositioning rate: Reduce by 60% (from 2.3 to 0.9 moves per departure)
- Average aircraft access time: Under 15 minutes for any aircraft
- Emergency response time: All aircraft accessible within 30 minutes
Financial Performance:
- Revenue per cubic foot: Include vertical space in calculations
- Labor cost per aircraft movement: Target reduction of 40%
- Hangar rash incidents: Reduce by 50% through better planning
- Customer satisfaction: Maintain 90%+ satisfaction with access times
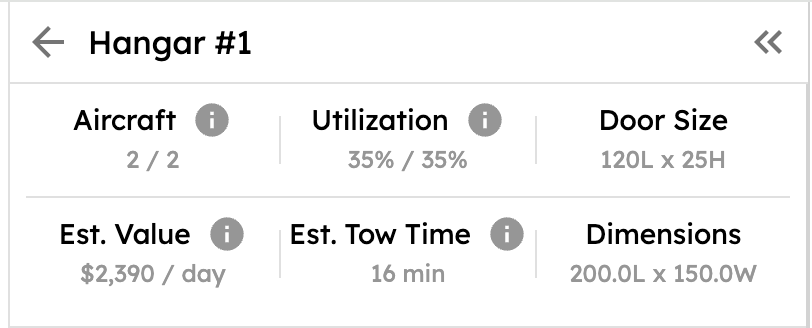 Track critical performance metrics in real-time: capacity utilization, revenue optimization, and safety compliance all in one dashboard
Common Implementation Pitfalls
Ignoring Customer Preferences: Some customers will pay premium rates to avoid stacking. Factor this into your revenue calculations.
Inadequate Safety Margins: Software minimums are just that – minimums. Operational safety requires larger clearances, especially in adverse weather.
The Future of Hangar Optimization: What's Coming in 2025 and Beyond
Autonomous Towing Revolution
The next frontier in 3D stacking involves robotic systems that execute plans automatically:
- AI-Powered Robotic Tugs: Companies like Airtrek Robotics are deploying autonomous towing vehicles that can move aircraft with millimeter precision, eliminating human error
- 24/7 Operations: Robots don't need breaks, reducing labor costs by up to 70%
- Zero Hangar Rash Goal: Automated systems with 360-degree sensors virtually eliminate ground incidents
- Integration Timeline: Major FBOs expect 30% automation by 2026
Digital Twin Technology
Creating virtual replicas of your hangar enables:
- Risk-Free Testing: Simulate thousands of configurations instantly
- Predictive Analytics: AI predicts optimal arrangements based on weather forecasts and flight schedules
- Real-Time Optimization: Continuous adjustment as conditions change
- Customer Portal Access: Allow operators to see exactly where their aircraft will be positioned
Smart Hangar Infrastructure
The "Hangar of the Future" incorporates:
- IoT Sensors: Monitor clearances, detect obstacles, and track environmental conditions
- Automated Lighting: LED systems that guide towing operations and highlight danger zones
- Climate-Controlled Zones: Different temperature zones for various aircraft types
- Integrated Charging: Electric aircraft infrastructure planning built into stacking algorithms
Summary for FBO Operators
The aviation industry is at an inflection point. With hangar space at historic premiums and weather events becoming more severe, the question isn't whether to implement 3D stacking – it's how quickly you can adapt to stay competitive.
The Bottom Line Impact:
Based on 2024 industry data, FBOs implementing comprehensive 3D stacking systems report:
- 35-42% increase in hangar capacity
- $200,000-$500,000 additional annual revenue (40,000 sq ft hangar)
- 61% reduction in aircraft repositioning
- 73% decrease in hangar rash incidents
- 2-7 month payback period
Critical Success Factors:
- Start with data: Track your current operations for 30 days before implementing
- Choose proven technology: Look for systems with 800+ aircraft models and AI optimization
- Invest in training: Budget 40-80 hours for comprehensive staff education
- Prioritize safety: Maintain 20% larger clearances than software minimums
- Plan for integration: Ensure compatibility with your FBO management system
The Competitive Edge:
Leading FBOs aren't just storing more aircraft – they're revolutionizing the customer experience. When Signature Flight Support can guarantee hangar space during a hurricane while competitors are full, that's not just operational excellence – it's market dominance.
Ready to Transform Your Hangar Operations?
Don't let another storm season pass while leaving money on the table. Every day without optimized 3D stacking means lost revenue, increased risk, and frustrated customers. The technology is proven, the ROI is clear, and your competitors are already moving.
Get Started Today: Calculate your potential ROI with our free hangar optimization assessment tool and see exactly how much revenue you're leaving on the runway.