How to Calculate Hangar Capacity (Step-by-Step Guide)
Published on March 2, 2026 • 5 min read
Your architect says the new hangar is 30,000 square feet. Your spreadsheet says that fits 10 midsize jets. On move-in day, you can barely fit 7.
The problem is not bad math. The problem is wrong math. Dividing floor area by aircraft footprint ignores the geometry, the doors, the towing paths, and the clearance rules that actually determine how many aircraft you can park and extract without a three-aircraft shuffle.
An AOPA survey found 71% of airports have hangar waiting lists. Demand is not the issue. Knowing what your hangar can actually hold is.
This guide walks through a five-step method for calculating hangar capacity that accounts for real-world constraints. We will use actual aircraft dimensions, published clearance guidance, and worked examples from AirPlx's 48 controlled simulation experiments (varying hangar dimensions while holding fleet mix, SOPs, and towing equipment constant) to show where spreadsheets fail and what to do instead.
Step 1: Measure Usable Area, Not Gross Area
Every hangar has dead space. Columns, fire suppression panels, egress paths, equipment zones, and door swing areas all subtract from the area you can actually park aircraft in.
Start with your gross interior footprint (measured at the interior face of walls), then subtract every "no-park" zone:
- Structural columns and supports: Even a 2x2 ft column creates a clearance bubble around it that kills parking options. Those weird hangar shapes and obstructions matter more than most people think.
- Fire protection equipment: NFPA 409 governs aircraft hangar fire protection. Foam suppression systems, pull stations, and access panels all need clearance. The National Air Transportation Association provides guidance on NFPA 409 compliance and hangar fire protection requirements.
- Egress paths: Local fire code typically requires marked exit corridors that cannot be obstructed.
- Equipment staging: GPU stations, tool carts, fuel carts, and wing walkers need to live somewhere.
- Door corridors: The approach lane for each hangar door is not parking space. Aircraft have to get in and out.
A typical 30,000 sq ft hangar loses 2,000 to 4,000 sq ft to these deductions, leaving 26,000 to 28,000 sq ft of usable storage area.
Treat every restriction as geometry. If you cannot draw a polygon around it and subtract it from the floor plan, you are guessing.
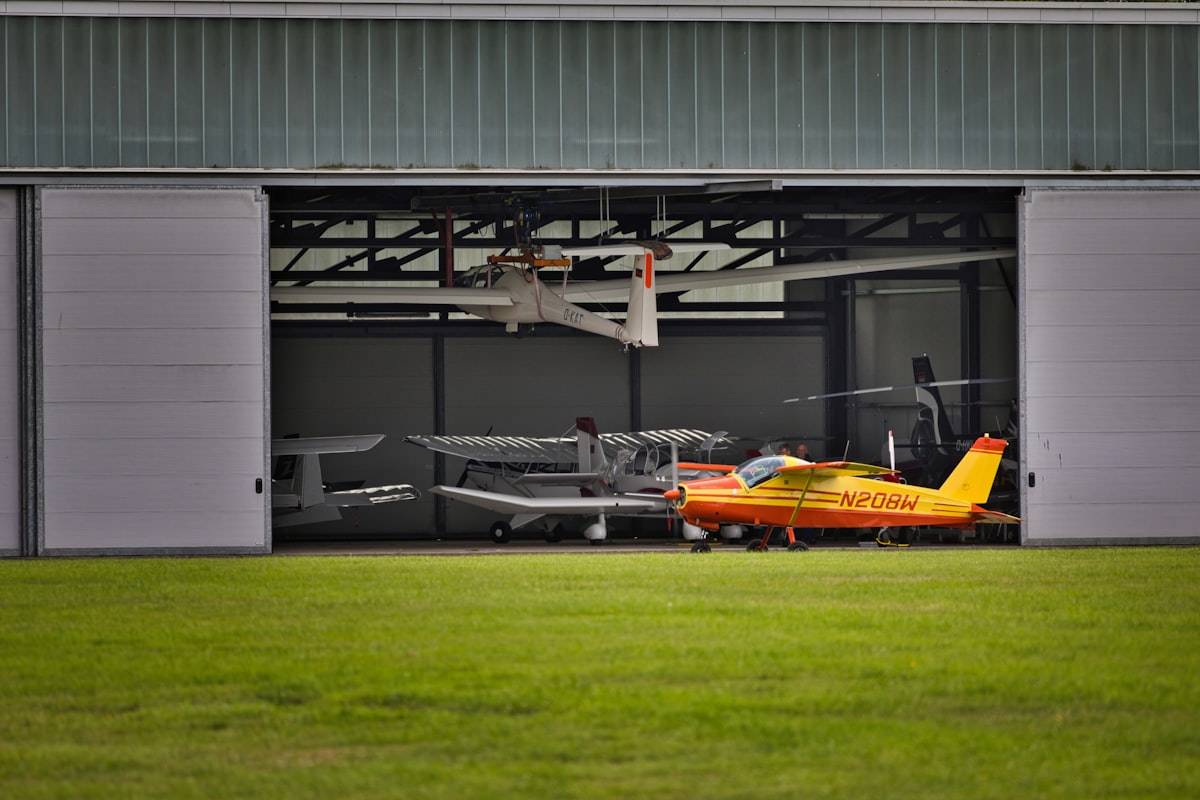
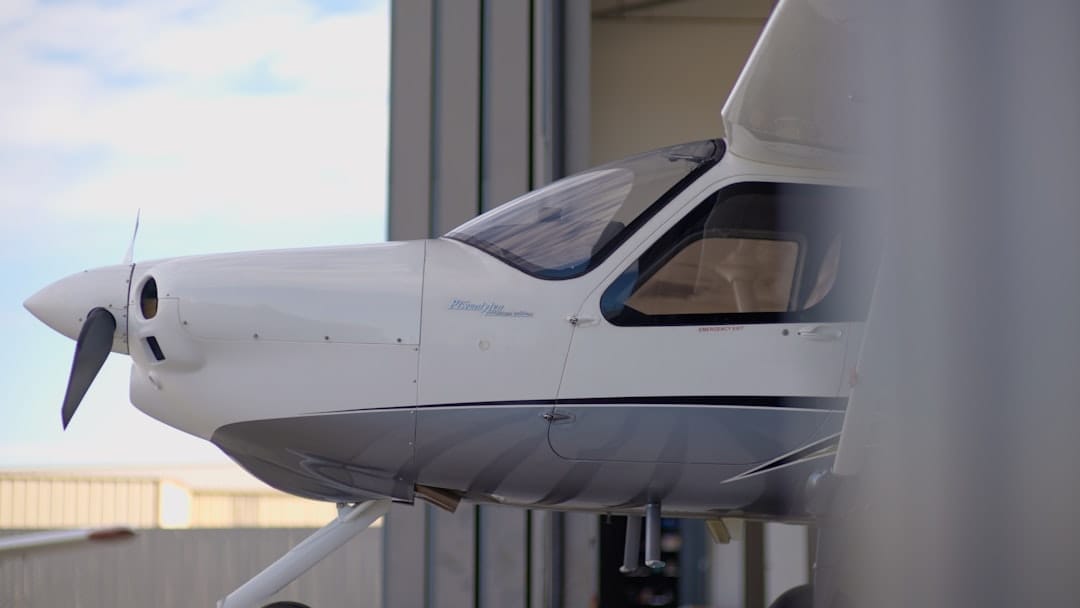 Usable area is the footprint that remains after subtracting every column, equipment zone, egress path, and door corridor. Photo via Unsplash.
Step 2: Define Aircraft Geometry and Clearance Envelopes
For each aircraft type you expect to park, you need three numbers: wingspan, length, and height (for door checks). Then you wrap each aircraft in a clearance envelope that accounts for your SOP clearance rules.
Here are common business aviation aircraft with conservative clearance envelopes applied (3 ft side, 5 ft nose, 5 ft tail):
| Aircraft | Wingspan (ft) | Length (ft) | Height (ft) | Envelope (ft) | Envelope Area (sq ft) |
|---|---|---|---|---|---|
| Gulfstream G700 | 103.0 | 109.9 | 25.3 | 109.0 x 119.9 | 13,069 |
| Bombardier Global 8000 | 104.0 | 111.0 | 27.0 | 110.0 x 121.0 | 13,310 |
| Dassault Falcon 6X | 85.1 | 84.3 | 24.5 | 91.1 x 94.3 | 8,591 |
| Cessna Citation XLS+ | 56.3 | 52.5 | 17.2 | 62.3 x 62.5 | 3,894 |
| Cessna Citation CJ4 | 50.8 | 53.3 | 15.4 | 56.8 x 63.3 | 3,596 |
| Embraer Phenom 300E | 52.2 | 51.3 | 16.8 | 58.2 x 61.3 | 3,568 |
| Beechcraft King Air 360 | 57.9 | 46.7 | 14.3 | 63.9 x 56.7 | 3,623 |
| HondaJet Elite II | 39.8 | 42.6 | 14.9 | 45.8 x 52.6 | 2,409 |
| Daher TBM 960 | 42.1 | 35.2 | 14.3 | 48.1 x 45.2 | 2,174 |
Dimensions sourced from OEM specifications (Gulfstream, Bombardier, Dassault, Textron Aviation, Embraer, Beechcraft, Honda Aircraft, Daher). Envelope assumes 3 ft side clearance, 5 ft nose/tail clearance. Your SOP clearances will differ.
These clearance numbers are not universal standards. They are tunable parameters that should match your SOPs. But they need to be explicit.
FAA Advisory Circular AC 150/5300-13B defines taxiway and taxilane object-free areas by airplane design group, with wingspan categories ranging from under 49 ft (Group I) up to 262 ft (Group VI). Each group has corresponding minimum clearance dimensions for safe surface movement. EASA's CS-ADR-DSN specifies stand clearances from 3 m to 7.5 m depending on aircraft code letter.
These are airfield standards, not hangar interior SOPs. But they illustrate a critical principle: clearance is a first-class design variable, not something to eyeball. Every extra 6 inches of clearance across 6 to 12 aircraft compounds into a full parking position you leave empty.
Step 3: Run the Spreadsheet Math (Then Label It Correctly)
For a single aircraft type, the upper bound is straightforward:
Upper Bound = Usable Area / Envelope Area
For a 27,000 sq ft usable area filled with Citation CJ4s (3,596 sq ft envelope each): 27,000 / 3,596 = 7.5, so 7 aircraft max.
For a mixed fleet, use a weighted average envelope based on your expected mix.
This number is an optimistic ceiling, not a plan. It ignores three things that kill real-world capacity:
- Packing losses: Aircraft are not rectangles. The rectangular envelope overestimates footprint. But parking is also not a bin-packing puzzle with perfect solutions. Irregular shapes leave gaps.
- Door corridors: Every aircraft needs a clear extraction path to a hangar door.
- Movement blocking: If extracting aircraft A requires moving aircraft B and C first, your "capacity" includes aircraft you cannot actually get to.
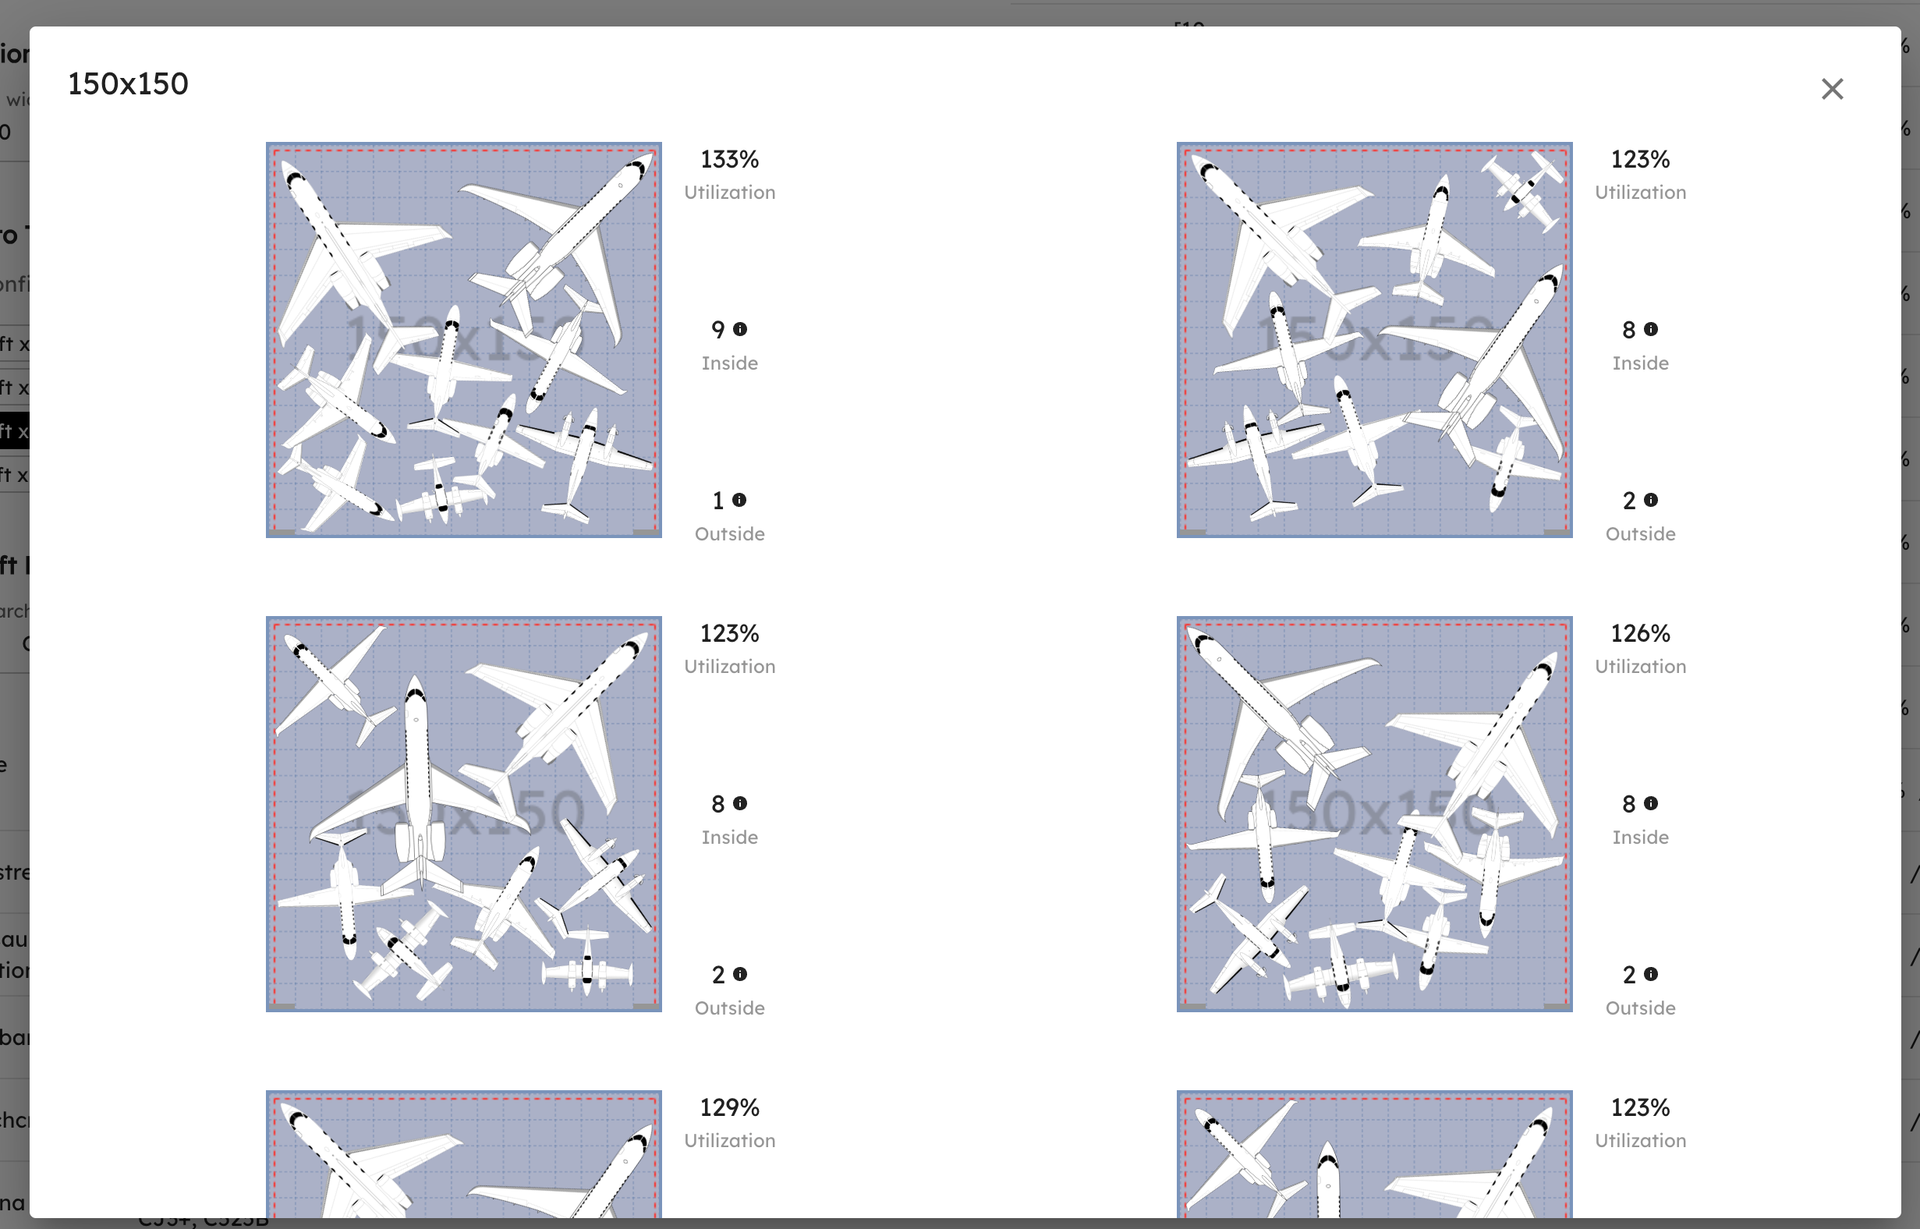
AirPlx's 48 controlled simulation experiments showed that capacity does not scale linearly with size. It unlocks in steps, driven by dimensional thresholds that spreadsheets cannot detect. Adding just 15 feet of depth from a 140x140 ft hangar to 140x155 ft took best-case capacity from 7 aircraft to 9 and worst-case from 5 to 6.
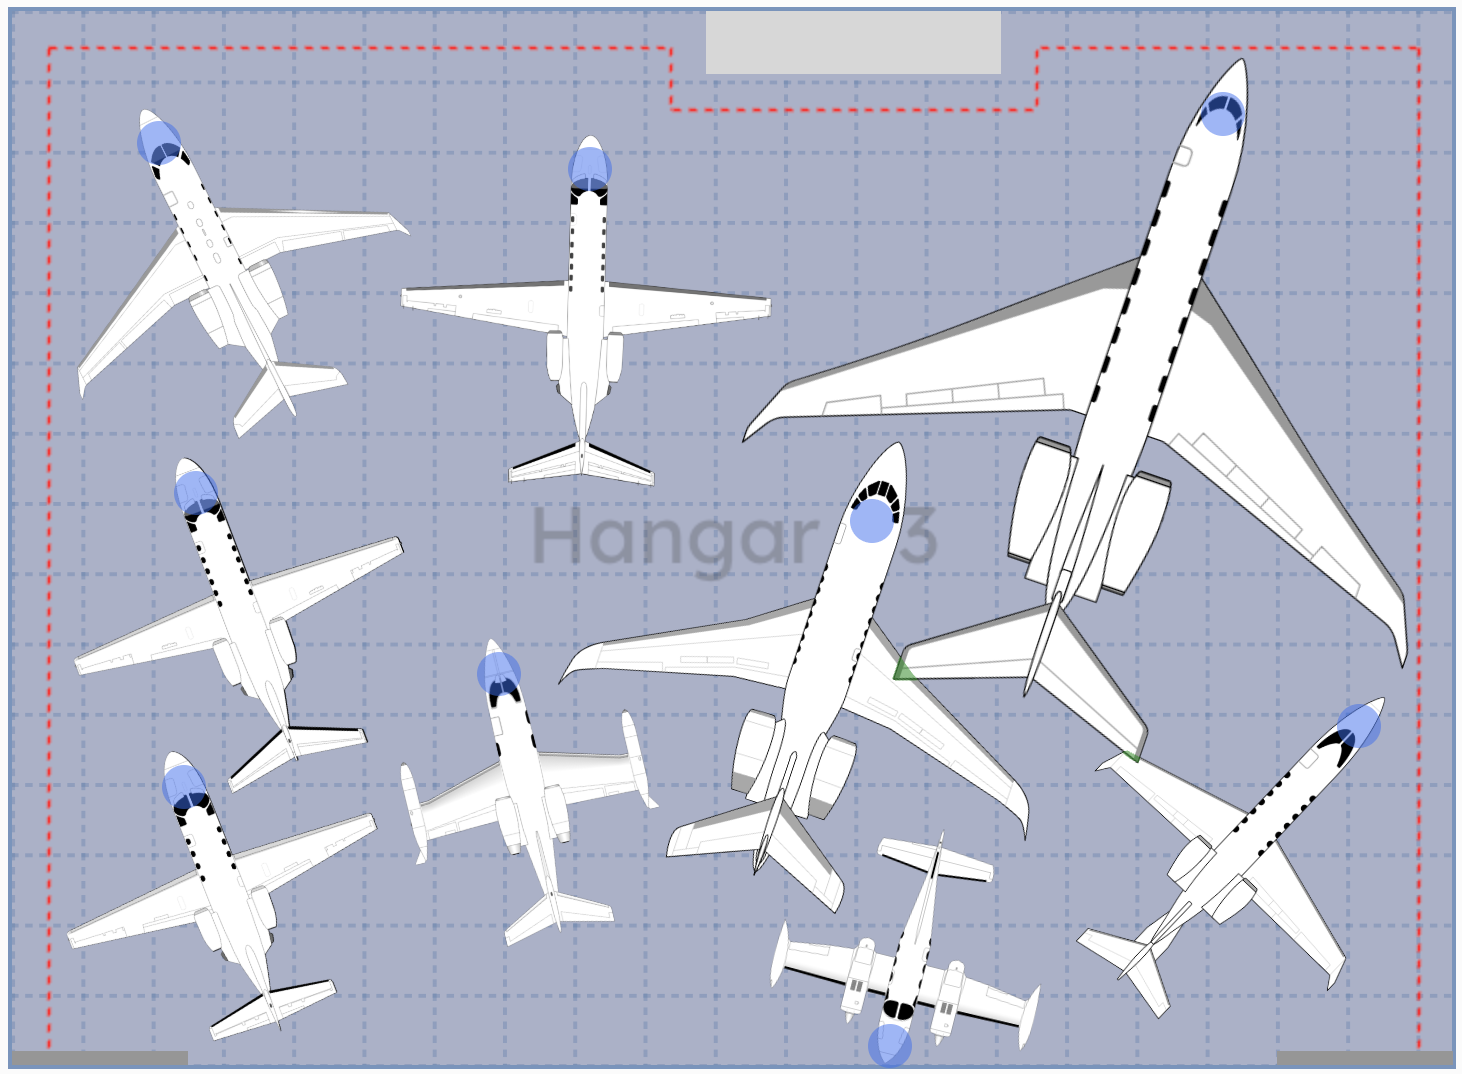
AirPlx simulation: 9 aircraft stacked in a 150x205 ft hangar at 107% utilization. The overlap zones between aircraft are where real capacity comes from.
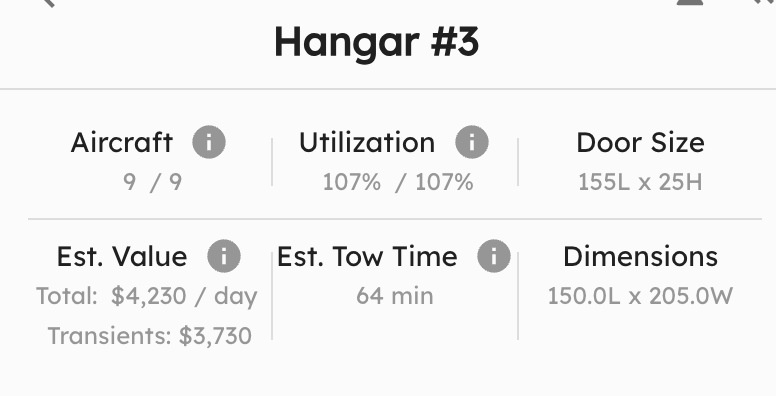 Stats panel for the layout above: 9/9 aircraft placed, 107% utilization, estimated value $4,230/day, 64-minute tow time. These metrics separate paper capacity from operational reality.
Step 4: Test Operational Feasibility
This is where most calculations fall apart. An aircraft "fitting" on paper is worthless if you cannot get it in and out without a three-aircraft shuffle.
Operational feasibility includes:
Door access: Can every aircraft reach a door without being blocked? Doors quietly control which layouts are viable. In AirPlx's tests, a 200x150 ft hangar (30,000 sq ft) averaged only 9 aircraft, while a narrower but deeper 192.5x157.5 ft hangar averaged 10. The difference was door access geometry.
Tug constraints: Your tug's turning radius, towbar length, and operator positioning determine which placements are reachable. Different tugs produce different capacity outcomes in the same hangar with the same fleet.
Wing sweep during movement: Swept-wing jets track wider than their static wingspan during turns. AirPlx measured wingtips tracking 4.2 ft wider than expected during towing turns on swept-wing aircraft. Static clearances that look safe on paper can fail during movement.
Overlap zones: Modern hangar stacking uses vertical overlap, tucking one aircraft's wing under another's tail. This is standard practice at most FBOs and is how utilization exceeds 100% of naive floor area calculations. But overlap requires precise height data and vertical clearance SOPs.
AirPlx validates three overlap conditions:
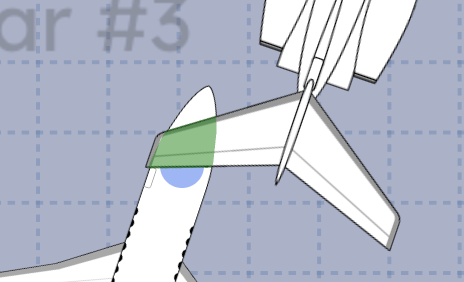 Green: safe overlap. One aircraft's wing passes under another's fuselage with clearance to spare. This is where capacity comes from.
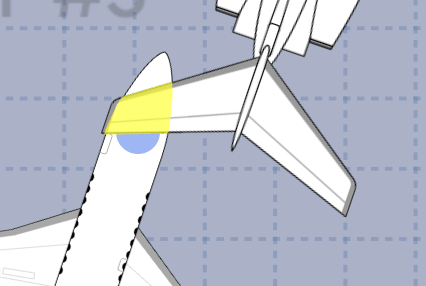 Yellow: SOP violation. Physically clear, but violates your configured vertical spacing rules. Not a collision, but not within your safety margins.
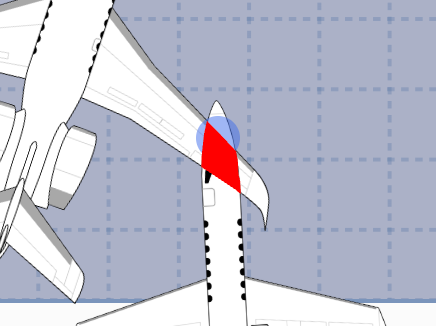 Red: collision. Physical interference between aircraft structures. This layout does not work.
The difference between green and yellow is your SOP clearance configuration. The difference between yellow and red is physics. A good capacity calculation accounts for both.
The NBAA recommends planning for unstacking, not just stacking. If you cannot get aircraft out without a 30-minute rehandling drill, your capacity number is fiction. For more on the fundamentals, see our hangar optimization best practices guide.
Step 5: Model Variance, Not Peak Fill
A hangar that fits 10 aircraft under ideal conditions but collapses to 6 when a late Gulfstream shows up is not a 10-aircraft hangar. It is a 6-aircraft hangar with occasional upside.
Your capacity calculation should output three numbers:
- Best case: Ideal stacking with a cooperative arrival sequence
- Worst case: Most constrained plausible scenario
- Stable operating range: What you can reliably maintain day-to-day
AirPlx's experiments consistently showed that larger, deeper hangars had narrower variance bands. A 140x140 ft hangar swung from 5 to 7 aircraft (40% variance). A 155x155 ft hangar swung from 8 to 10 (25% variance). Stability matters more than peak fill.
With ground damage to aircraft costing the industry $5 billion annually according to IATA (projected to hit $10 billion by 2035), the cost of pushing a tight layout too hard is not abstract. And if inactive aircraft are eating slots that revenue-generating transients could use, the compounding cost is even worse. Those hangar queens are more expensive than most operators realize.
Translate Capacity to Revenue
Capacity is an operational number. Revenue is the number your CFO cares about. Here is how they connect.
Based aircraft: Each slot represents monthly hangar rent plus predictable service revenue. For midsize jets, typical monthly contributions run $3,000 to $7,000 depending on market and aircraft size.
Transient opportunity: Each overnight visit from a transient aircraft generates approximately $2,250 to $2,400 in total revenue (fuel margin, ramp fees, auxiliary services, and secondary services).
Scaling that up: one additional midsize jet per week is $124,800 annually. If higher utilization or better stacking lets you accommodate just one more transient overnight per week, that is the annual upside.
For a 30,000 sq ft hangar, AirPlx's simulation data shows a typical improvement of 3 additional aircraft. Here is how that translates: 3 additional based slots at $4,000 to $5,000 per month each produces $144,000 to $180,000 in annual revenue. If some of those slots serve transients instead (at $2,400 per overnight visit), the math shifts but the order of magnitude holds. AirPlx conservatively estimates $150K to $180K annually for operations at this scale. The difference between 85% and 95% utilization is not marginal. It is someone's salary.
If you regularly turn away aircraft, the losses compound fast. AirPlx estimates that turning away 6 midsize jets per month produces roughly $172,800 in annual lost revenue.
The Most Common Mistake
The most common mistake in hangar capacity planning is treating it as an area division problem. Dividing square footage by aircraft footprint gives you a number. It just gives you the wrong one.
Real capacity is a geometry problem constrained by doors, towing paths, clearance rules, and arrival sequence variance. The step-function nature of capacity, where 5 extra feet of depth can unlock an entire additional aircraft, means the only reliable method is to model the geometry directly.
Get a Capacity Report Based on Your Real Constraints
If you want to run this analysis on your actual hangar, book a demo and we will simulate your exact dimensions, doors, obstacles, fleet mix, and SOPs. You get back best-case, worst-case, and stable operating capacity, plus the revenue translation for each scenario.
Upload your hangar outline, door locations, obstacles, and SOP clearances. We run the simulation with realistic towing and extraction rules and return a capacity report that accounts for everything this guide covers, including the stuff a spreadsheet never will.
Or if you are scoping a new build, run your numbers through the ROI calculator to see what different dimensional choices mean for your bottom line.