Why Hangar Utilization Does Not Scale With Square Footage
Published on February 9, 2026 • 5 min read
You are sitting in a pre-construction meeting. The architect says adding 20 feet of width will solve your capacity problem. The numbers on the spreadsheet look right. More square footage, more aircraft, more revenue.
We ran 48 controlled layout experiments inside AirPlx to test that assumption. Holding aircraft mix, SOPs, spacing rules, and towing equipment constant, we varied hangar dimensions in small increments. The result: hangar utilization does not scale linearly with size.
Capacity unlocks in steps, not smooth curves.
Often triggered by surprisingly small dimensional changes, adding square footage in the wrong direction can do nothing at all.
With 71% of GA airports reporting hangar waitlists and construction costs pushing $90–$150 per square foot for business aviation-grade facilities, getting the dimensions right the first time isn't optional. Whether you're an operator, developer, or planner making real capital decisions, this data changes how you think about hangar design.
How We Ran the Test
To isolate the effect of hangar dimensions alone, we kept everything else fixed across all runs:
- Same aircraft mix (ranging from Cessna 310s to Gulfstream G450s)
- Same spacing rules (2 ft horizontal, 8 ft vertical)
- Same overlap assumptions
- Same towing equipment
- Same planning constraints
The only thing that changed from run to run was hangar width and depth.
Each configuration was tested across 18 stacking strategies, and we recorded worst-case, best-case, and average outcomes rather than a single optimized layout.
We tested three scenarios across 48 total hangar configurations.
A note on utilization: We measure utilization as the percentage of usable hangar floor area occupied by aircraft footprints (wingspan times length). Values above 100% mean aircraft footprints overlap — one aircraft's wing, nose, or tail extends into the negative space of another aircraft's rectangular bounding box. That negative space is the area within the footprint rectangle that the aircraft itself doesn't physically occupy, and it's where the real capacity gains come from. In some cases this includes vertical overlap — wings tucked under tails, noses staggered beneath higher fuselages — but the principle is using the unused space within each other's footprints. This is standard practice in 3D aircraft stacking and is how most FBOs maximize capacity in real operations.
See how many aircraft fit in your hangar
AirPlx calculates optimized 3D stacking layouts for your exact hangar dimensions.
Run a free layout simulationScenario 1: 140–155 ft Range
Setup: 10 ft doors on each side, Lektro 87X tug, fleet of 10 aircraft types including Gulfstream G450, Falcon 6X, Learjet 31, King Air 300, Citation CJ3, Hawker 900XP, and Cessna singles.
Focus on the worst-case and best-case aircraft columns. Notice where a small dimensional change adds an entire aircraft — and how the worst-to-best gap narrows as hangars grow.
Takeaway: Five to fifteen feet of depth can unlock an entirely new aircraft slot.
Capacity doesn't climb smoothly — it unlocks in steps. Adding just 15 feet of depth from 140×140 to 140×155 takes best-case from 7 aircraft to 9 and worst-case from 5 to 6. That extra depth crosses a threshold that enables a completely different class of layouts.
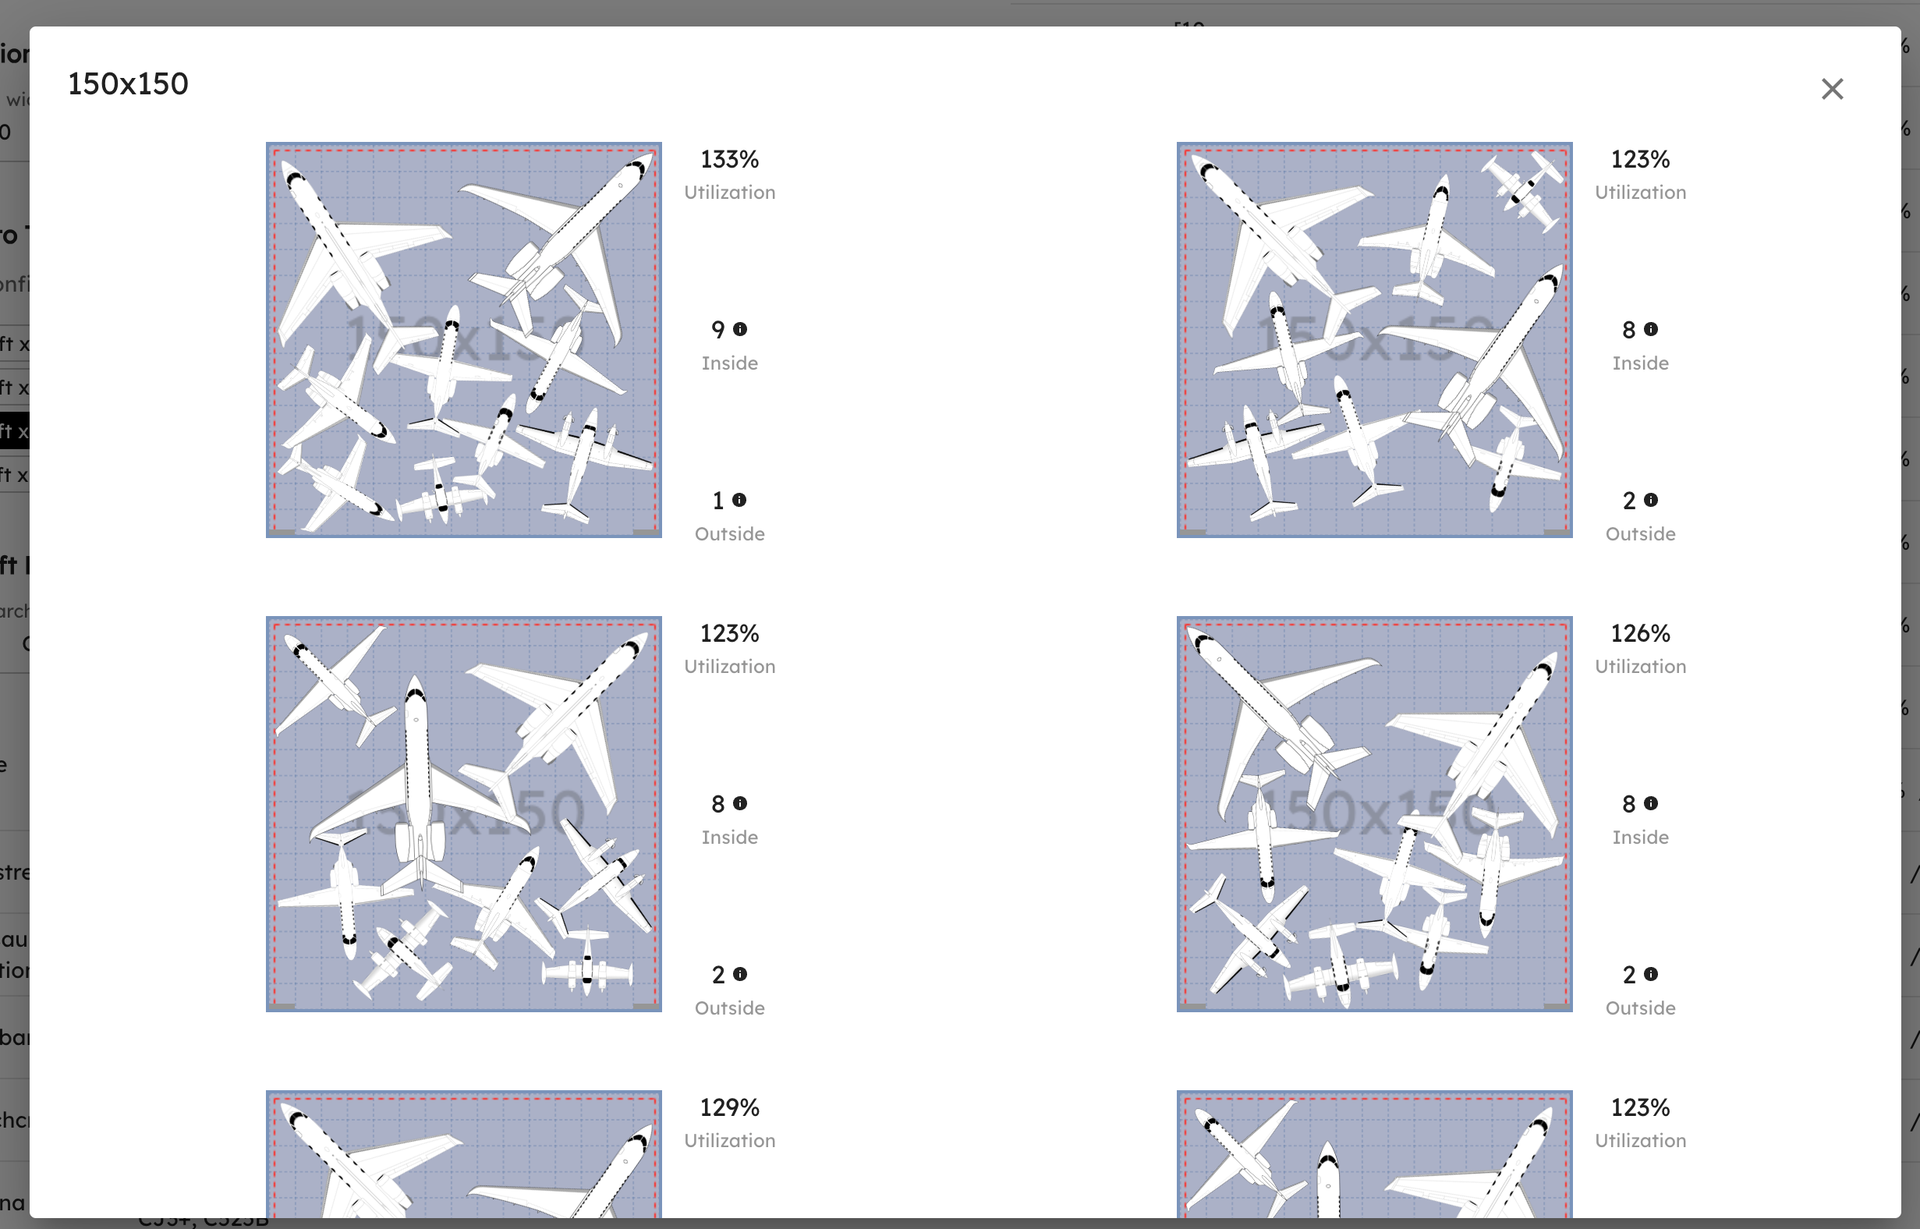
Now compare 150×150 and 155×150. Five more feet of width pushes best-case from 9 to 10 aircraft and worst-case from 7 to 8. Another step change from a modest dimensional shift.
Capacity unlocks in steps, not smooth curves.
What does that mean in dollars? One additional aircraft slot in a hangar this size typically holds a midsize jet paying $3,000–$5,000/month in rent. Over a year, that single slot is worth $36,000–$60,000 in hangar revenue alone, before fuel and services. The construction cost to add those 5 extra feet of depth during a new build? Roughly $37,500–$55,000 at current rates. That's a payback period of under two years for a decision made during the design phase.
There's a cost asymmetry here too: depth is cheaper to add than width. Width drives clear-span engineering (heavier steel, larger door systems) which can represent 15–25% of total construction cost. Depth just adds more identical frame bays. So the dimension that unlocks more capacity also costs less to build.
150×150 ft hangar: notice how aircraft cluster toward the center, leaving dead space along the edges. The square geometry forces this.
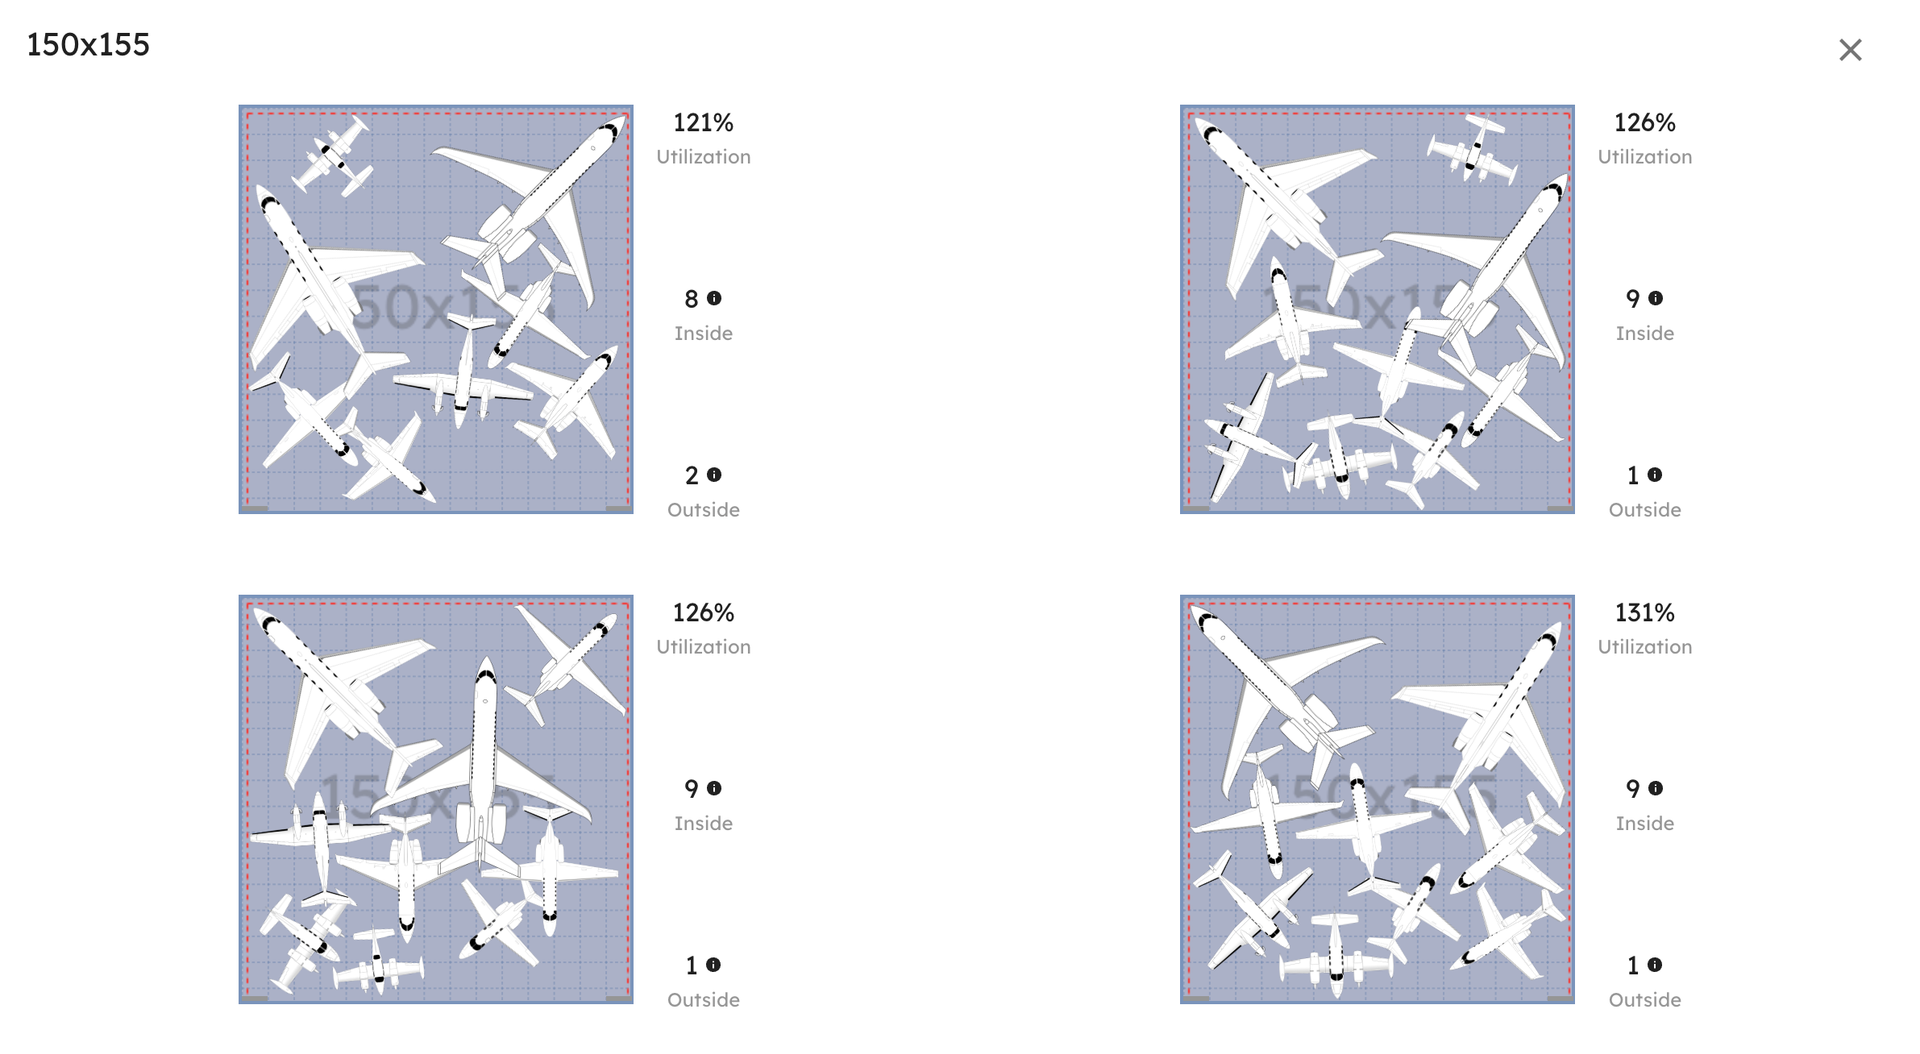 150×155 ft hangar: with 5 more feet of depth, aircraft can stagger nose-to-tail without blocking the doors. That geometric shift unlocks the 10th aircraft.
Scenario 2: Large Hangars (185–207.5 ft range)
Setup: 15 ft doors on each side, Lektro AP8750CX tug, expanded fleet of 15 aircraft types adding Gulfstream G400, Citation X, Cirrus SF50 Vision Jet, Cirrus SR22, and Embraer Phenom 100.
The key signal is not utilization percentage — it's where the aircraft count jumps.
Takeaway: Similar square footage can differ by 2–3 aircraft depending on the width-to-depth ratio.
The 207.5×157.5 configuration fits up to 12 aircraft with a worst-case of 10. Compare that to 185×135 where worst-case is 6 and best-case is 9. That's a massive operational difference, but the square footage only increased about 30%. Same step-function pattern: going from 200×142.5 to 200×157.5 — just 15 feet of depth — jumps best-case from 10 to 12 aircraft and average from 9 to 10.
The revenue math on that 15 feet: Two additional best-case aircraft slots holding large-cabin jets (think Gulfstream G400s or Citation Xs at $4,000–$7,000/month each) is $96,000–$168,000 in additional annual hangar revenue. The marginal construction cost for 15 feet of depth on a 200-foot-wide hangar is approximately $75,000–$112,500. Again, payback within one to two years.
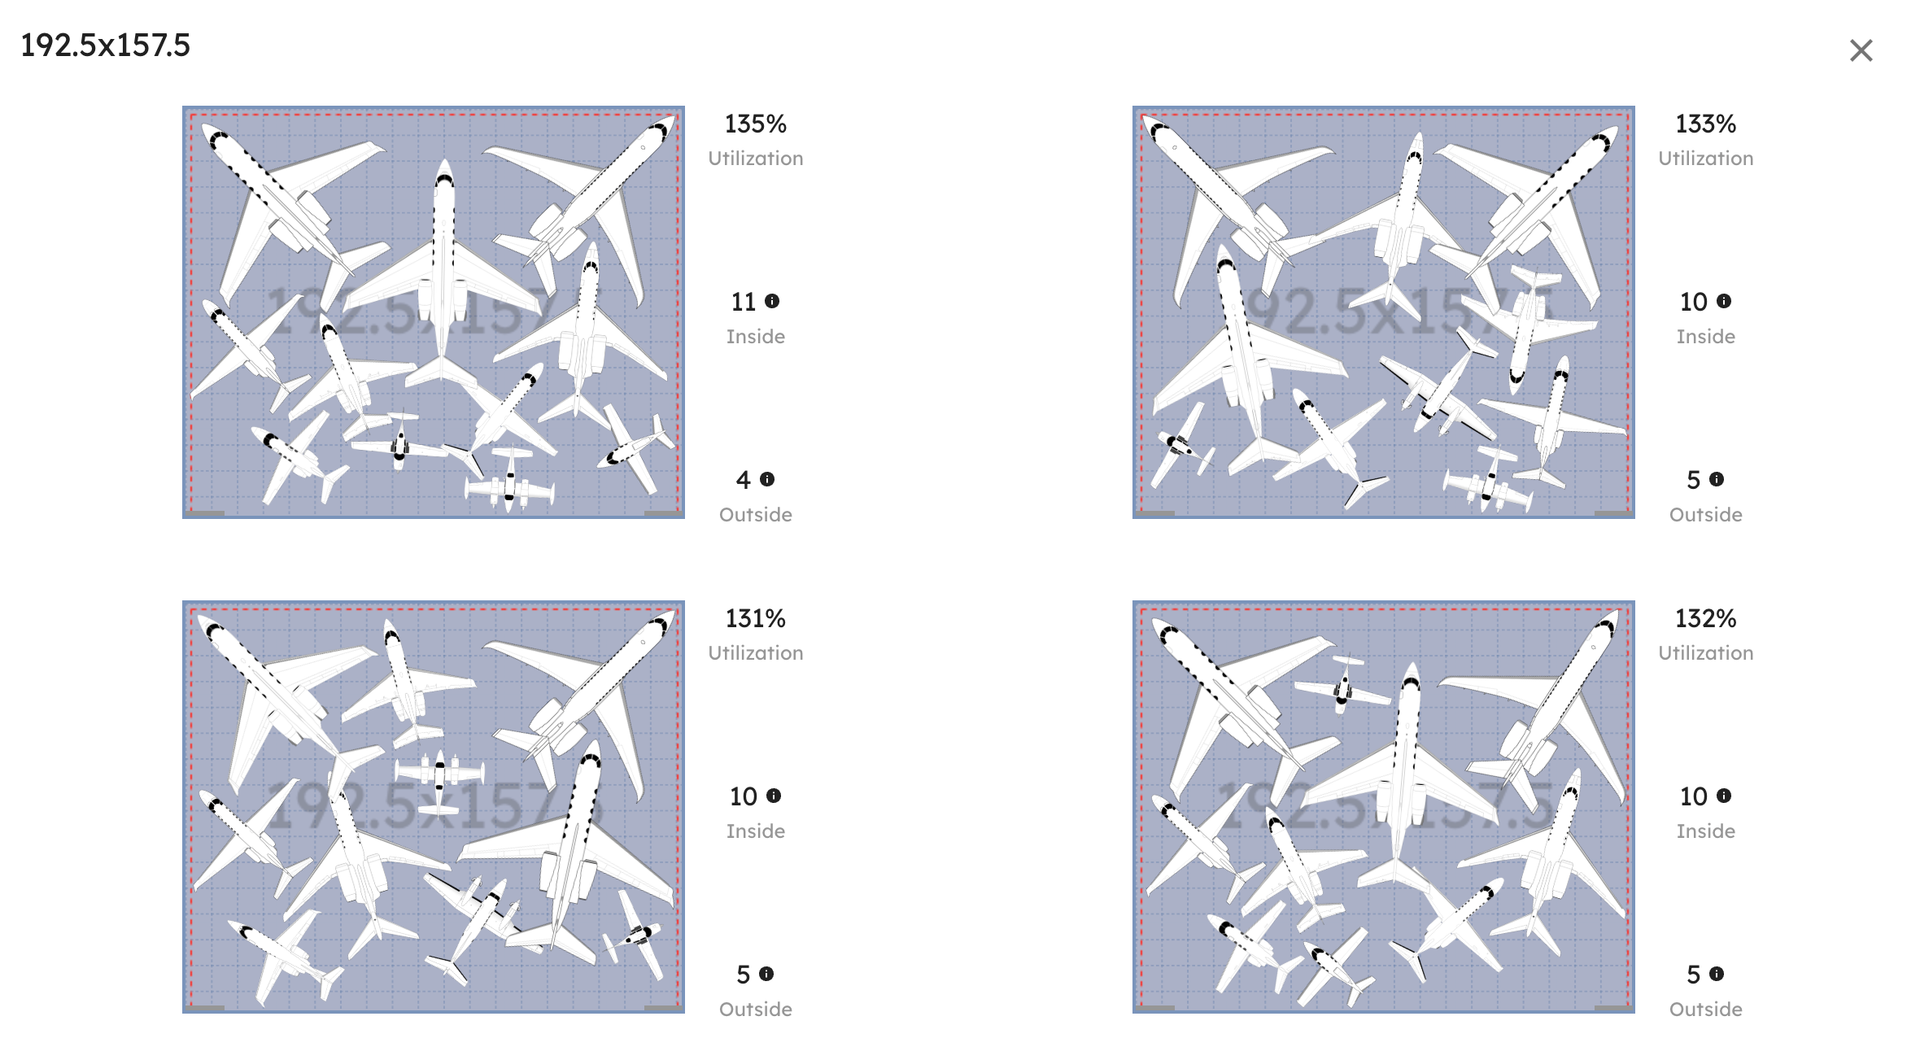 192.5×157.5 ft hangar: the extra depth allows angled placements in the back row that a shallower hangar cannot support. That's where the 11th aircraft fits.
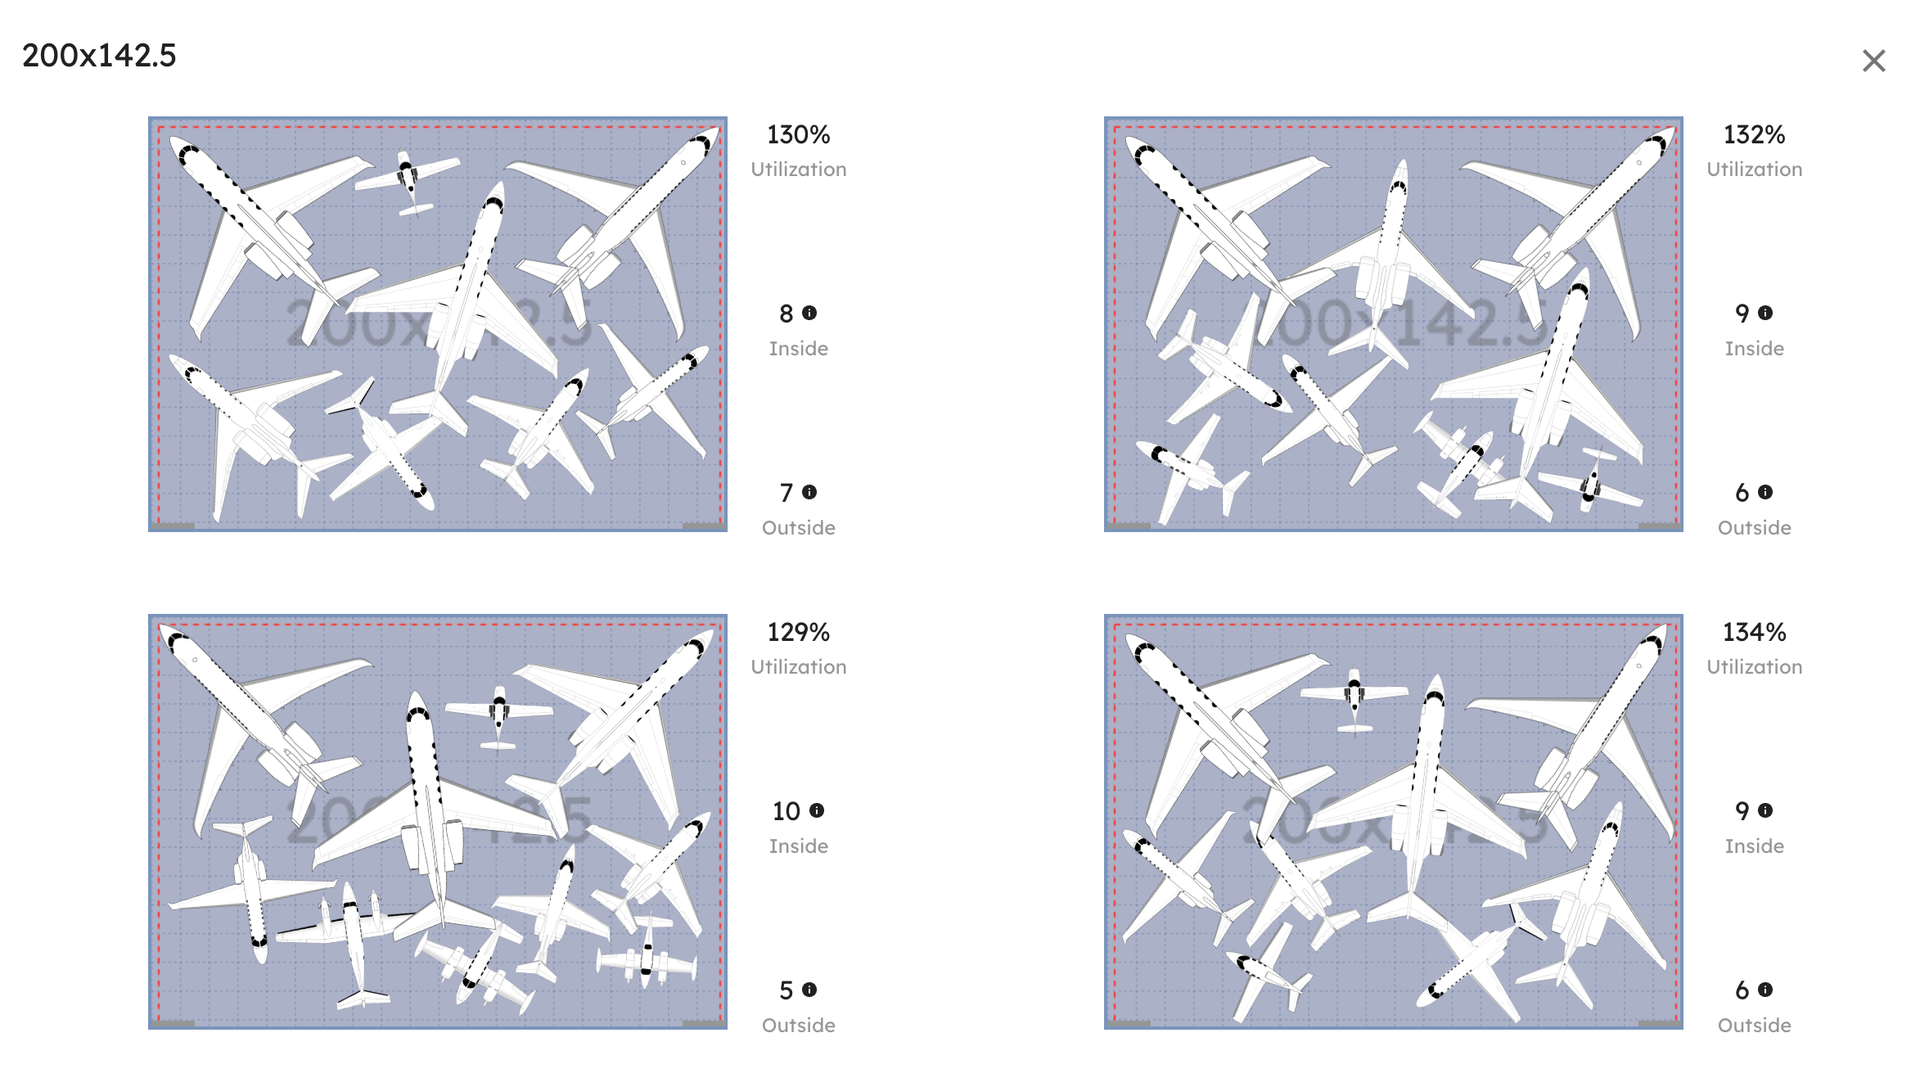 200×142.5 ft hangar: wider but shallower — notice the unused space behind the front row. The depth constraint prevents a second full stacking layer.
Scenario 3: Mid-Size Hangars (155–177.5 ft range)
Setup: 15 ft doors on each side, Lektro AP8750CX tug.
The mid-size scenario confirmed the same step-function pattern. A 155×135 hangar (20,925 sq ft) topped out at 7 aircraft best-case. Adding 15 feet of width to get 170×135 (22,950 sq ft) — about 10% more area — pushed best-case to 8 and average from 6 to 7. That width increase crosses a threshold where wider aircraft can stagger without blocking the door.
But depth again outperformed width. The 170×135 versus 170×157.5 comparison tells the story: same width, 22.5 more feet of depth, and worst-case jumps from 5 to 7 aircraft. The 177.5×157.5 configuration pushed best-case to 10 aircraft and worst-case to 7.
Depth consistently outperforms width as a capacity driver.
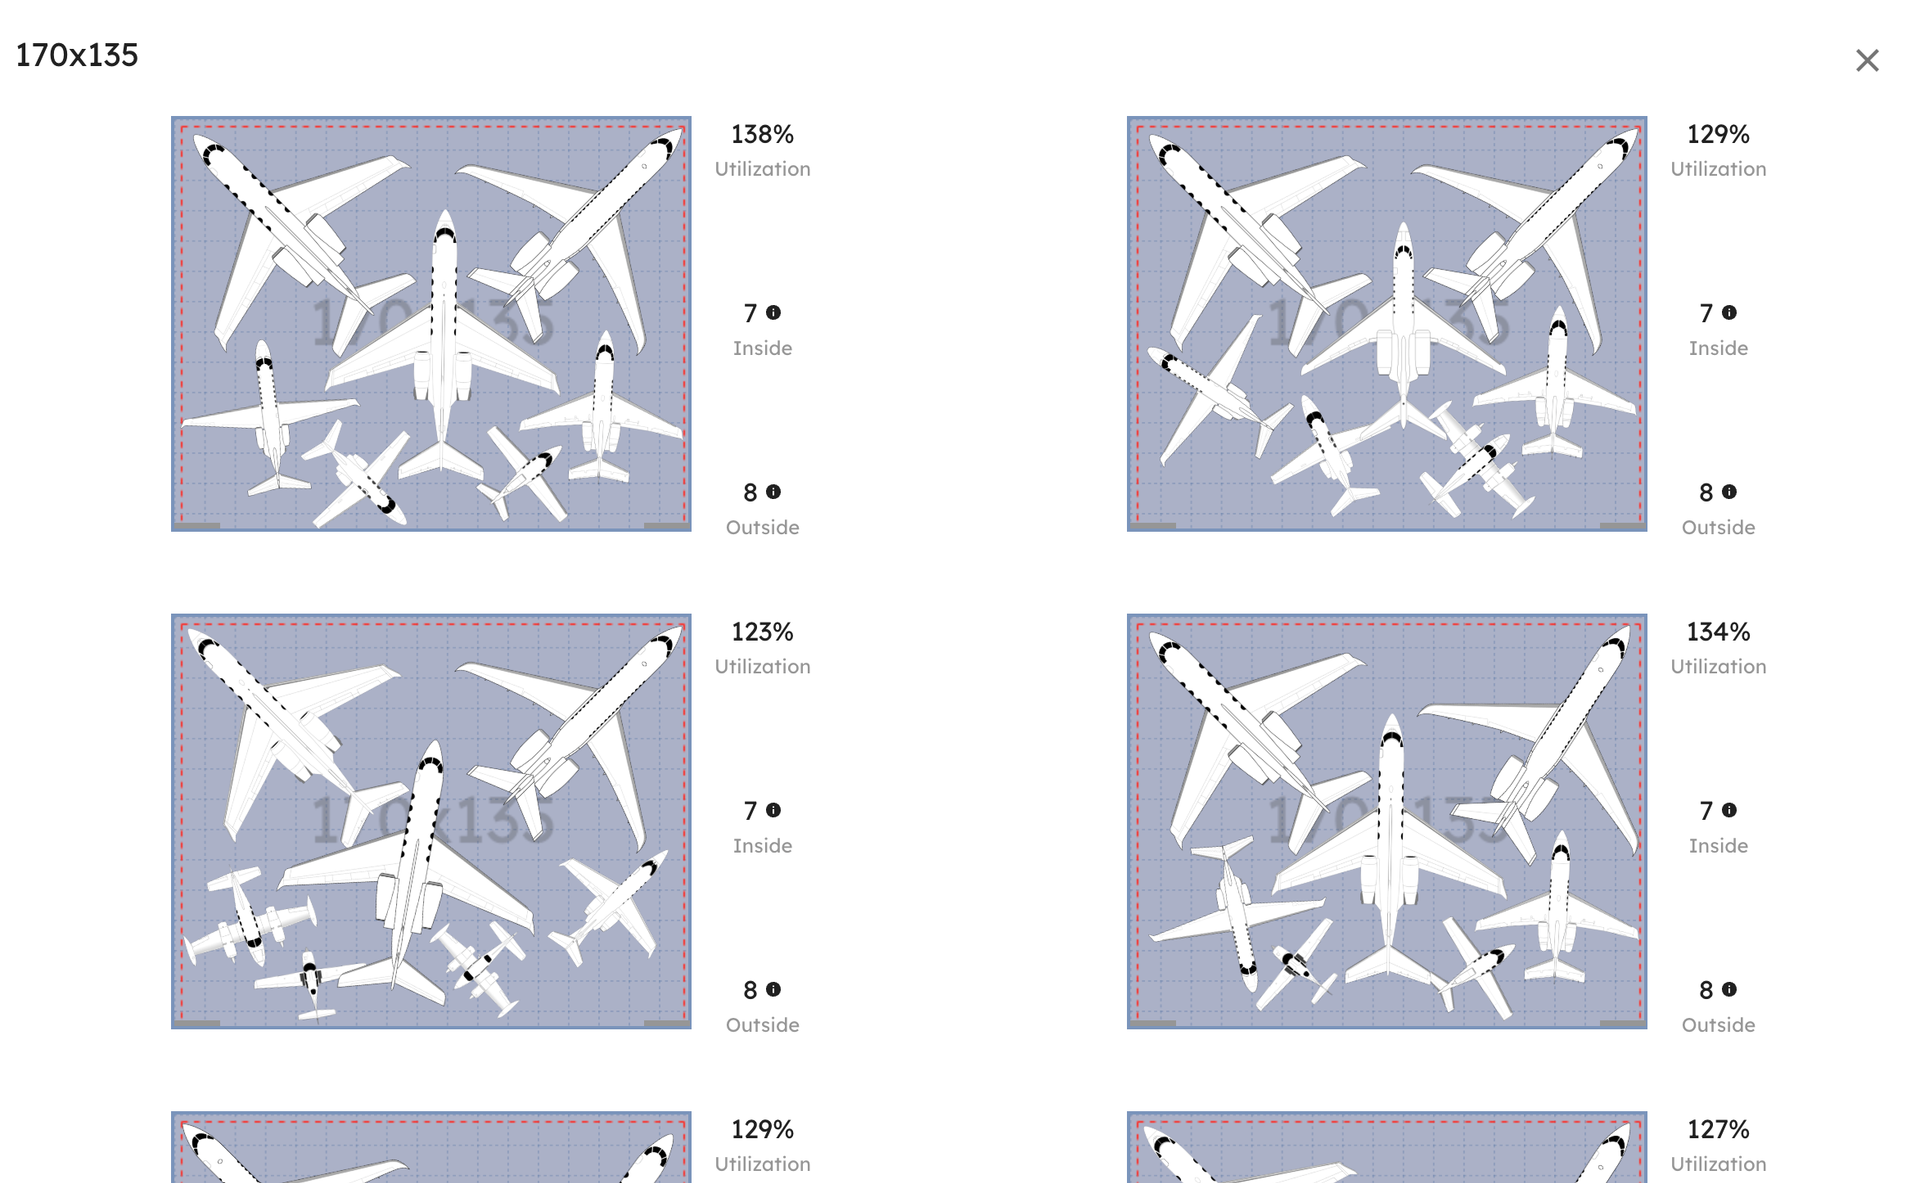 170×135 ft hangar: extra width opens lateral space, but the shallow depth leaves no room for nose-to-tail staggering.
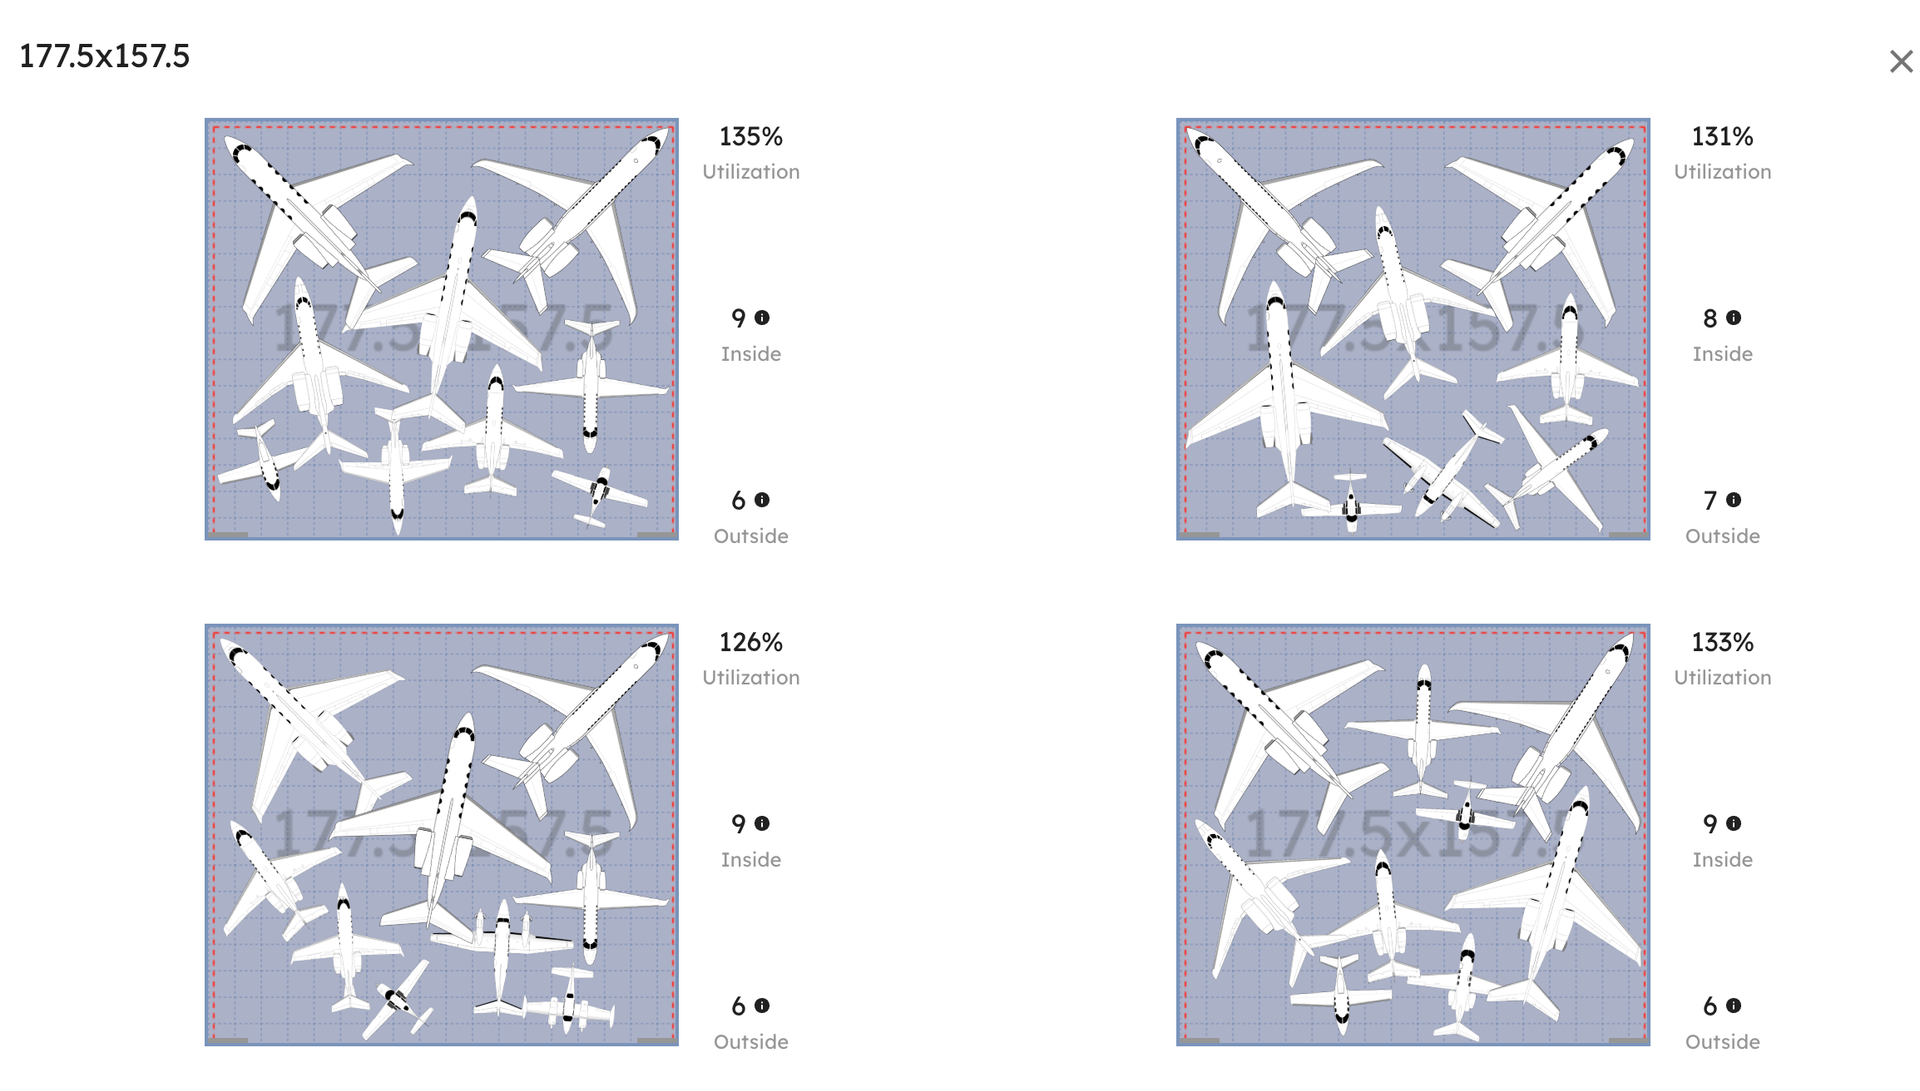 177.5×157.5 ft hangar: depth and width working together — aircraft fill the back row in angled positions that the 170×135 layout couldn't support.
Why Width and Depth Behave Differently
Aircraft length, tail clearance, and wing sweep dominate layout feasibility. Depth enables nose-to-tail staggering, angled placements without door conflicts, and better absorption of mixed aircraft sizes. Width, on the other hand, often creates unusable edge space unless it crosses a very specific threshold.
This is why a 155×140 hangar (21,700 sq ft) often performs worse than a 150×155 hangar (23,250 sq ft). The depth-biased layout enables stacking arrangements that the wider, shallower layout cannot support.
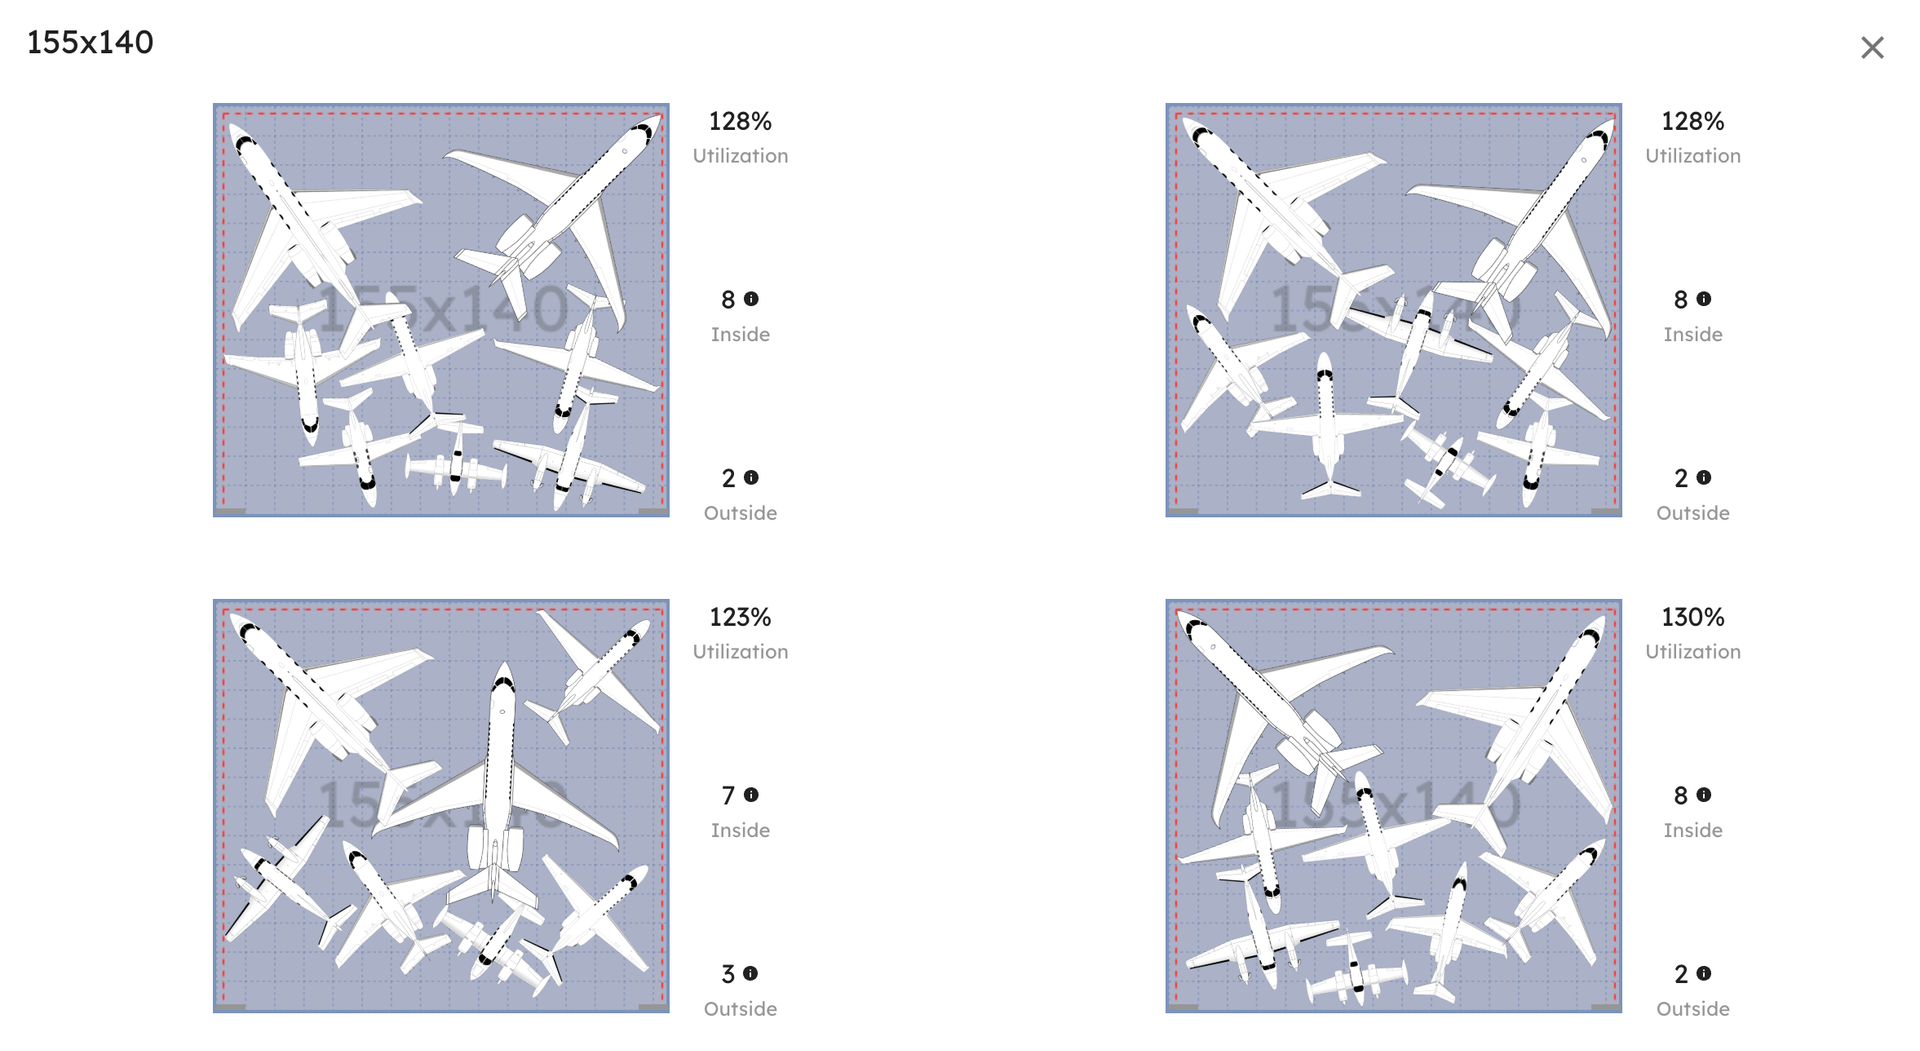 155×140 ft hangar: compare to the 150×155 layout above — the wider, shallower shape leaves gaps that the deeper hangar fills with staggered placements.
Doors Quietly Control Everything
Door constraints quietly control which layouts are viable. In the scenario 2 data, the 200×150 configuration only averages 9 aircraft despite having 30,000 sq ft, while the narrower but deeper 192.5×157.5 averages 10 with slightly more total area. The difference is effective door access — certain stacking arrangements become operationally impossible when aircraft cannot be cleared without rehandling.
With modern large-cabin jets now requiring 28-foot-high doors and aircraft footprints that have grown 81% since 2010 for the largest models, door planning is more consequential than ever. A door that was adequate for a Challenger 604 may not work for the Global 7500 that replaces it.
Stability Matters More Than Peak Utilization
One finding that keeps showing up: larger hangars are not just able to hold more aircraft. They are more stable.
Look at the worst-to-best spread in scenario 1. The 140×140 hangar swings from 5 to 7 aircraft, a 40% variance. The 155×155 hangar swings from 8 to 10, only a 25% variance. In our tests, larger hangars reduced worst-case capacity swings by roughly one-third. Larger hangars offer more valid layouts and more tolerance for disruption.
This matters because on a real ramp, you rarely get to pick your arrival sequence. A late Gulfstream, a repositioned King Air, or a last-minute transient can collapse a tight layout. Bigger hangars absorb that variance.
Utilization should be framed less as "how full can we get once" and more as: how consistently can we stay comfortably full without constant re-planning?
A hangar running at 70% every day is operationally healthier than one that occasionally hits 95% but frequently collapses under variance. And with average aircraft downtime from ground incidents running $225,000 per event, the cost of pushing a tight layout too hard is real.
What This Means for Hangar Planning
If you are evaluating a new build, an expansion, or even just trying to understand why your current hangar underperforms, here are the practical takeaways:
- Square footage alone is a poor predictor of usable capacity. Two hangars within 5% of each other in total area can differ by 2–3 aircraft in practice. That gap can represent $72,000–$168,000/year in lost hangar revenue.
- Small dimensional changes can unlock disproportionate gains. Five to fifteen feet in the right direction can add an entire aircraft slot, and the marginal construction cost ($37,500–$112,500) typically pays back within two years.
- Capacity increases arrive in steps, not smooth curves. Spreadsheet models that assume linear scaling will mislead you. Model the geometry or you will get it wrong.
- Depth and doors matter more than width. Depth enables staggering and costs less to build. Doors determine which layouts are operationally viable.
- Plan for variance, not peak fill. The best hangar is one that performs consistently across different fleet mixes and arrival patterns.
These dynamics are exactly why static spreadsheets and one-off layout sketches tend to mislead planning teams. Without modeling the geometry and the variability together, it's easy to overestimate what a hangar can reliably support.
The Most Common Mistake
The most common hangar planning mistake we see is assuming that size equals flexibility. In reality, geometry equals flexibility, and flexibility is what drives real utilization.
Once you see these patterns, it becomes much easier to understand why two hangars of similar size behave completely differently on a busy ramp day. Once you see how non-linear these effects are, guessing based on square footage alone stops making sense.
If you're evaluating a real hangar, the natural next step is to test your exact dimensions and fleet mix. Book a demo and we'll run the analysis together, or if you're scoping a new build or expansion, calculate your potential ROI to see what different dimensional choices actually mean for revenue.