FIFA Friday: The Departure Wave
Published on April 3, 2026 • 4 min read
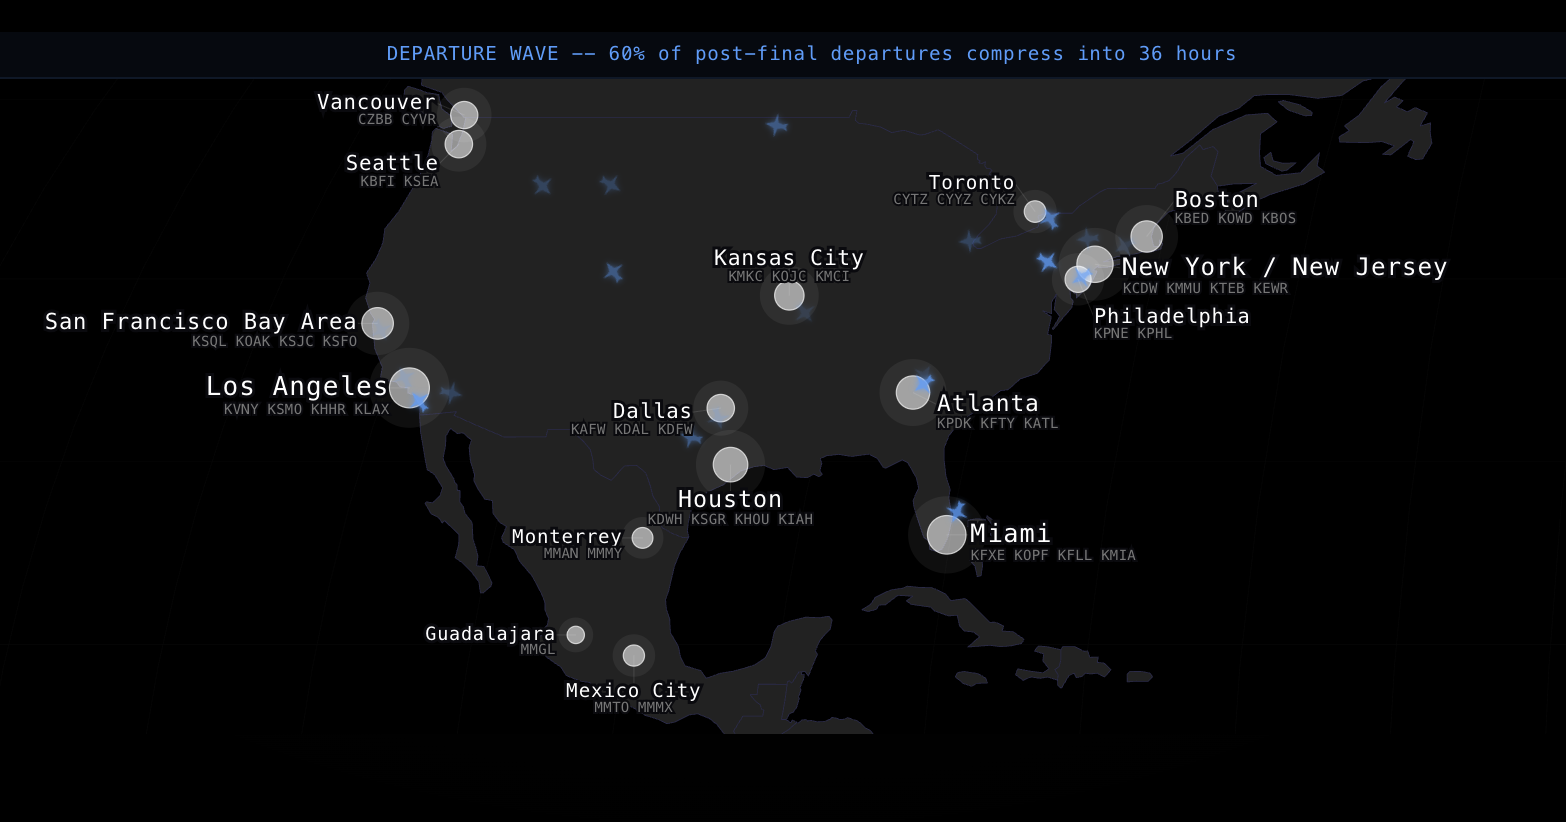
This is the first in our FIFA Friday series. Every week through the World Cup, we're digging into real flight data to surface what the 2026 tournament actually means for private aviation operations. We built a full interactive simulation of bizav traffic across all 16 host cities. These posts are the micro-insights that came out of that work.
Every FBO operator who has worked a Super Bowl knows that arrivals get all the attention. Flight trackers post ramp photos. Local news runs "jets are flooding in" segments. Planning meetings focus on where to park 40 extra Gulfstreams.
Then the game ends. And 36 hours later, every single one of those aircraft wants to leave at the same time.
We analyzed 780,000 bizav flights across four Super Bowls and three FIFA World Cups. The pattern is remarkably consistent: game day is a lull. The real operational crunch is the departure wave that hits the next morning.
The Super Bowl Pattern: Game Day vs. the Morning After
Here are real departure counts from host-area airports across the last four Super Bowls:
| Super Bowl | City | Game Day | Monday (+1) | Spike |
|---|---|---|---|---|
| LIX (Feb 2025) | New Orleans | 13 | 68 | 5.2x |
| LVIII (Feb 2024) | Las Vegas | 189 | 286 | 1.5x |
| LX (Feb 2026) | Bay Area | 108 | 219 | 2.0x |
| LVII (Feb 2023) | Phoenix | 107 | 218 | 2.0x |
New Orleans is the extreme case. Game day saw just 13 departures across the metro area's bizav airports. The next morning: 68. That is a 5.2x spike, and at fields like Lakefront (KNEW) and Louis Armstrong (KMSY), 68 departures in a single morning can overwhelm ramp infrastructure built for a fraction of that volume.
Source: AirPlx analysis of 780K bizav flights, 2023-2026
The chart tells the story. Across all four Super Bowls, game day is a valley, not a peak. The surge starts Monday morning and can extend through Tuesday or even Wednesday depending on the city.
See how many aircraft fit in your hangar
AirPlx calculates optimized 3D stacking layouts for your exact hangar dimensions.
Run a free layout simulationThe Vegas Effect
Las Vegas is the outlier. LVIII saw 189 departures on game day, higher than most host cities because Vegas traffic runs hot regardless. But the real peak didn't hit until Tuesday: 386 departures, more than double game day.
Vegas gives people a reason to stay an extra night. The departure wave doesn't just shift. It stretches. For FBOs at Henderson Executive and Harry Reid, that meant three consecutive days of elevated departure traffic instead of one concentrated Monday morning rush.
The Pattern Holds at World Cups, But the Departure Clock Shifts
This isn't a Super Bowl quirk. World Cup data from 2018 and 2022 shows the same post-event departure spike, but with a twist: the surge starts hours earlier.
| World Cup | Airport | Day After Final | Daily Average | Spike |
|---|---|---|---|---|
| 2018 Russia | Vnukovo (Moscow) | 60 departures | ~15-20 | 3-4x |
| 2022 Qatar | OTBD (Doha) | 54 departures | ~15 | 3.6x |
| 2014 Brazil | SBGL (Rio) | 17 departures | n/a | Biggest single day |
But here's what the daily totals don't show: when those departures happen. We broke down hourly departure counts across all bizav-capable airports in each World Cup host city. The peak isn't 9 AM. It's 3 AM.
Source: AirPlx analysis of metro-wide bizav departures at WC 2018 and WC 2022 host cities
Doha logged 90 departures at 3 AM UTC, then another 81 at 6 AM. Rostov peaked at 98 departures at 5 AM. Kazan sustained 30-34 departures per hour for three straight hours starting at 3 AM. Owners and operators want wheels-up before the next wave of inbound aircraft arrives. That means your line crew needs to be unstacking a packed ramp at 3 AM: fuel trucks running in the dark, tugs working zero-margin spacing, GPUs cycling through pre-flight checks by flashlight.
Why 2026 Multiplies the Problem (and the Revenue)
A Super Bowl creates one departure wave after one game. The 2026 World Cup creates dozens: 104 matches across 16 cities over 39 days (June 11 through July 19). Some venues host group stage matches just 3-4 days apart, meaning Monday's departure wave overlaps with Wednesday's arrival wave. The ramp never fully clears.
For FBOs at host airports like Teterboro (serving MetLife Stadium), Dallas Love Field, or the Bay Area fields, this isn't a single weekend to white-knuckle through. It is weeks of overlapping surges with no clean reset.
But these departure waves are also revenue events. Special event fees at FBOs now range from $500 for light jets to $25,000+ for ultra-long-range aircraft, with large-cabin jets typically running $5,000 to $15,000 per aircraft at major events. Stack fuel on top: 30 departures uplifting 500 gallons each at $8/gallon is $120,000 in fuel revenue before lunch. Add handling and overnight fees, and a single well-executed departure wave can generate $200,000+ for a prepared operation. A botched one, with aircraft waiting 90 minutes for fuel on a jammed ramp, sends those owners to a competitor next time.
The question for FBOs near World Cup venues isn't whether the Monday morning exodus will happen. The data says it will. The question is whether your operation is ready for what happens at 4 AM when 40 jets all need to leave before the next round of arrivals starts at noon.
This is the first post in our FIFA Friday series, where we use real flight data to preview the operational challenges of the 2026 World Cup. Explore the simulation below to see how departure waves could stack up at your nearest host city.