FBO Ramp Revenue Optimization: A Data-Driven Playbook for Maximizing Slot Performance
Published on April 21, 2025 • 6 min read
Your ramp operates at 55% occupancy during peak hours while the FBO down the taxiway achieves 80% with higher rates. The difference? They're not just parking planes—they're optimizing slots like a hotel manages rooms.
Transform underutilized ramp space into measurable revenue growth with this systematic approach. Combined with hangar optimization strategies, ramp optimization creates comprehensive revenue growth.
The Revenue Opportunity
Most FBO operators think about ramp management in terms of "Do we have space?" Strategic operators think in terms of "What's this slot worth per hour?"
According to multiple industry sources, including the Aviation Business Strategies Group's 2024 FBO Survey, the average FBO operates at 45-65% ramp utilization during peak periods, leaving massive revenue on the table. A typical mid-sized FBO with 20 ramp slots averaging $25/hour can lose $50,000-$200,000 annually through poor slot management.
The Math: At 20 slots × 8 peak hours × 250 operating days = 40,000 slot-hours annually. The difference between 55% and 80% utilization represents 10,000 additional slot-hours. At $25/hour, that's $250,000 in potential revenue—before considering premium pricing opportunities.
Maximize every square foot with these proven strategies.
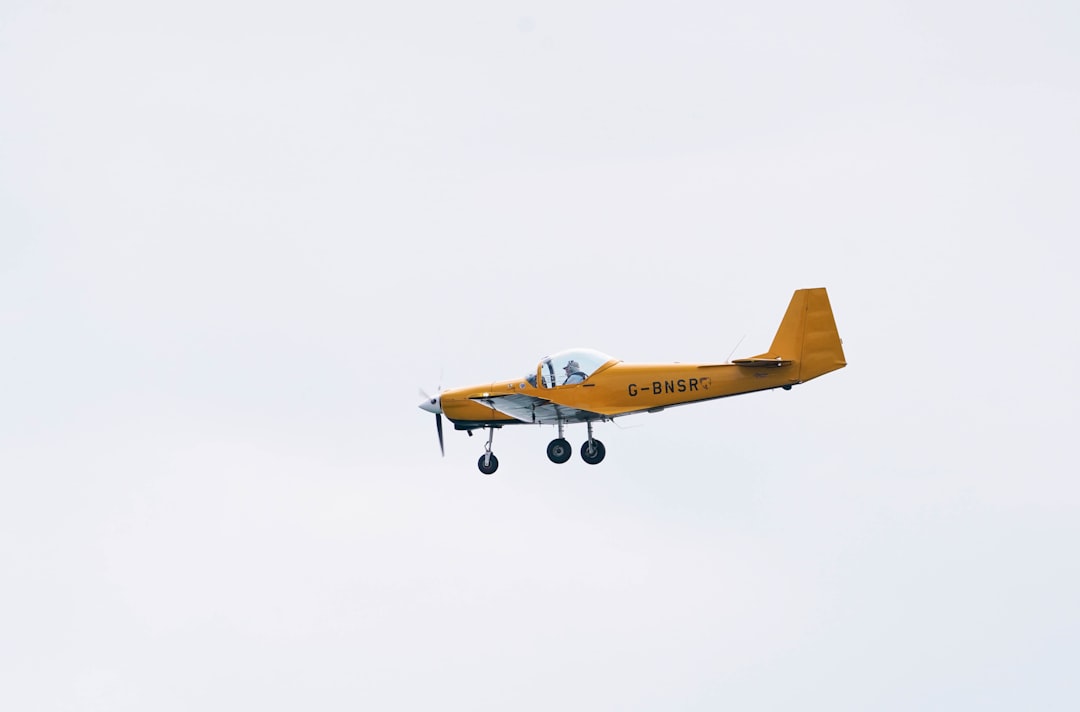
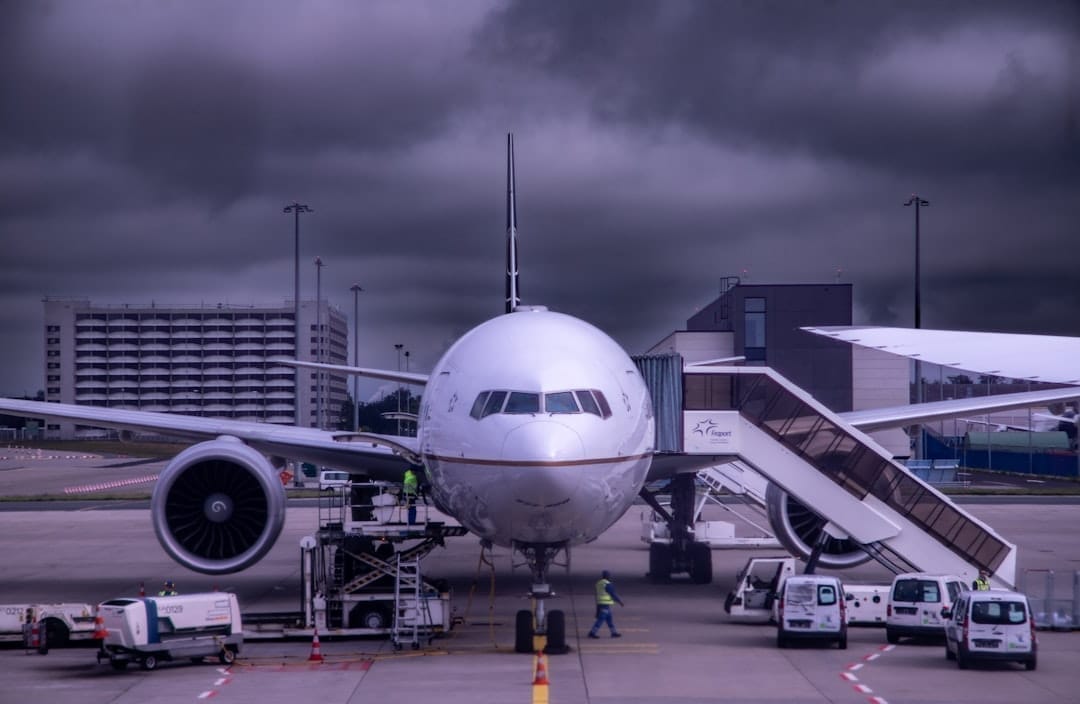
 Modern FBO ramp operations require strategic positioning and real-time management
Step 1: Define Your Revenue Metrics
Before optimizing, establish key performance metrics. These four measurements will guide your decisions:
Ramp Occupancy Rate
- Formula: % of total ramp slots occupied over a given period
- Target: 70-85% during peak hours, 40-60% off-peak
Turn Time
- Formula: Average time from aircraft arrival to departure
- Target: Less than 30 minutes for transient aircraft, less than 60 minutes for fuel-only stops
Revenue per Slot-Hour
- Formula: Total ramp fees ÷ total occupied slot-hours
- Target: $15-25 per slot-hour depending on market
Idle Slot Cost
- Formula: Opportunity cost of an empty slot per hour
- Target: Track to identify peak demand windows
Track these metrics weekly to identify emerging patterns and opportunities.
Step 2: Data Collection That Actually Works
Begin with existing systems and data sources:
Pull Your Gate/Slot Logs
- Arrival/departure timestamps from your existing system
- Calculate occupancy trends by day-of-week and season
- FAA Operations Network data shows peak GA traffic patterns you can benchmark against—typically 8am-6pm weekdays with 70% higher activity than off-peak hours
Simple Demand Modeling
- Track peak vs. off-peak windows (typically 8am-6pm weekdays)
- Use 7-day moving averages to forecast next-month slot requirements
- Identify your "rush hour" equivalent—when demand exceeds capacity
Customer Segmentation
Break out usage by:
- Aircraft category (light jet, turboprop, piston)
- Customer type (charter, based, transient)
- Service requirements (fuel, overnight, quick turn)
This data reveals your highest-value segments and their scheduling patterns.
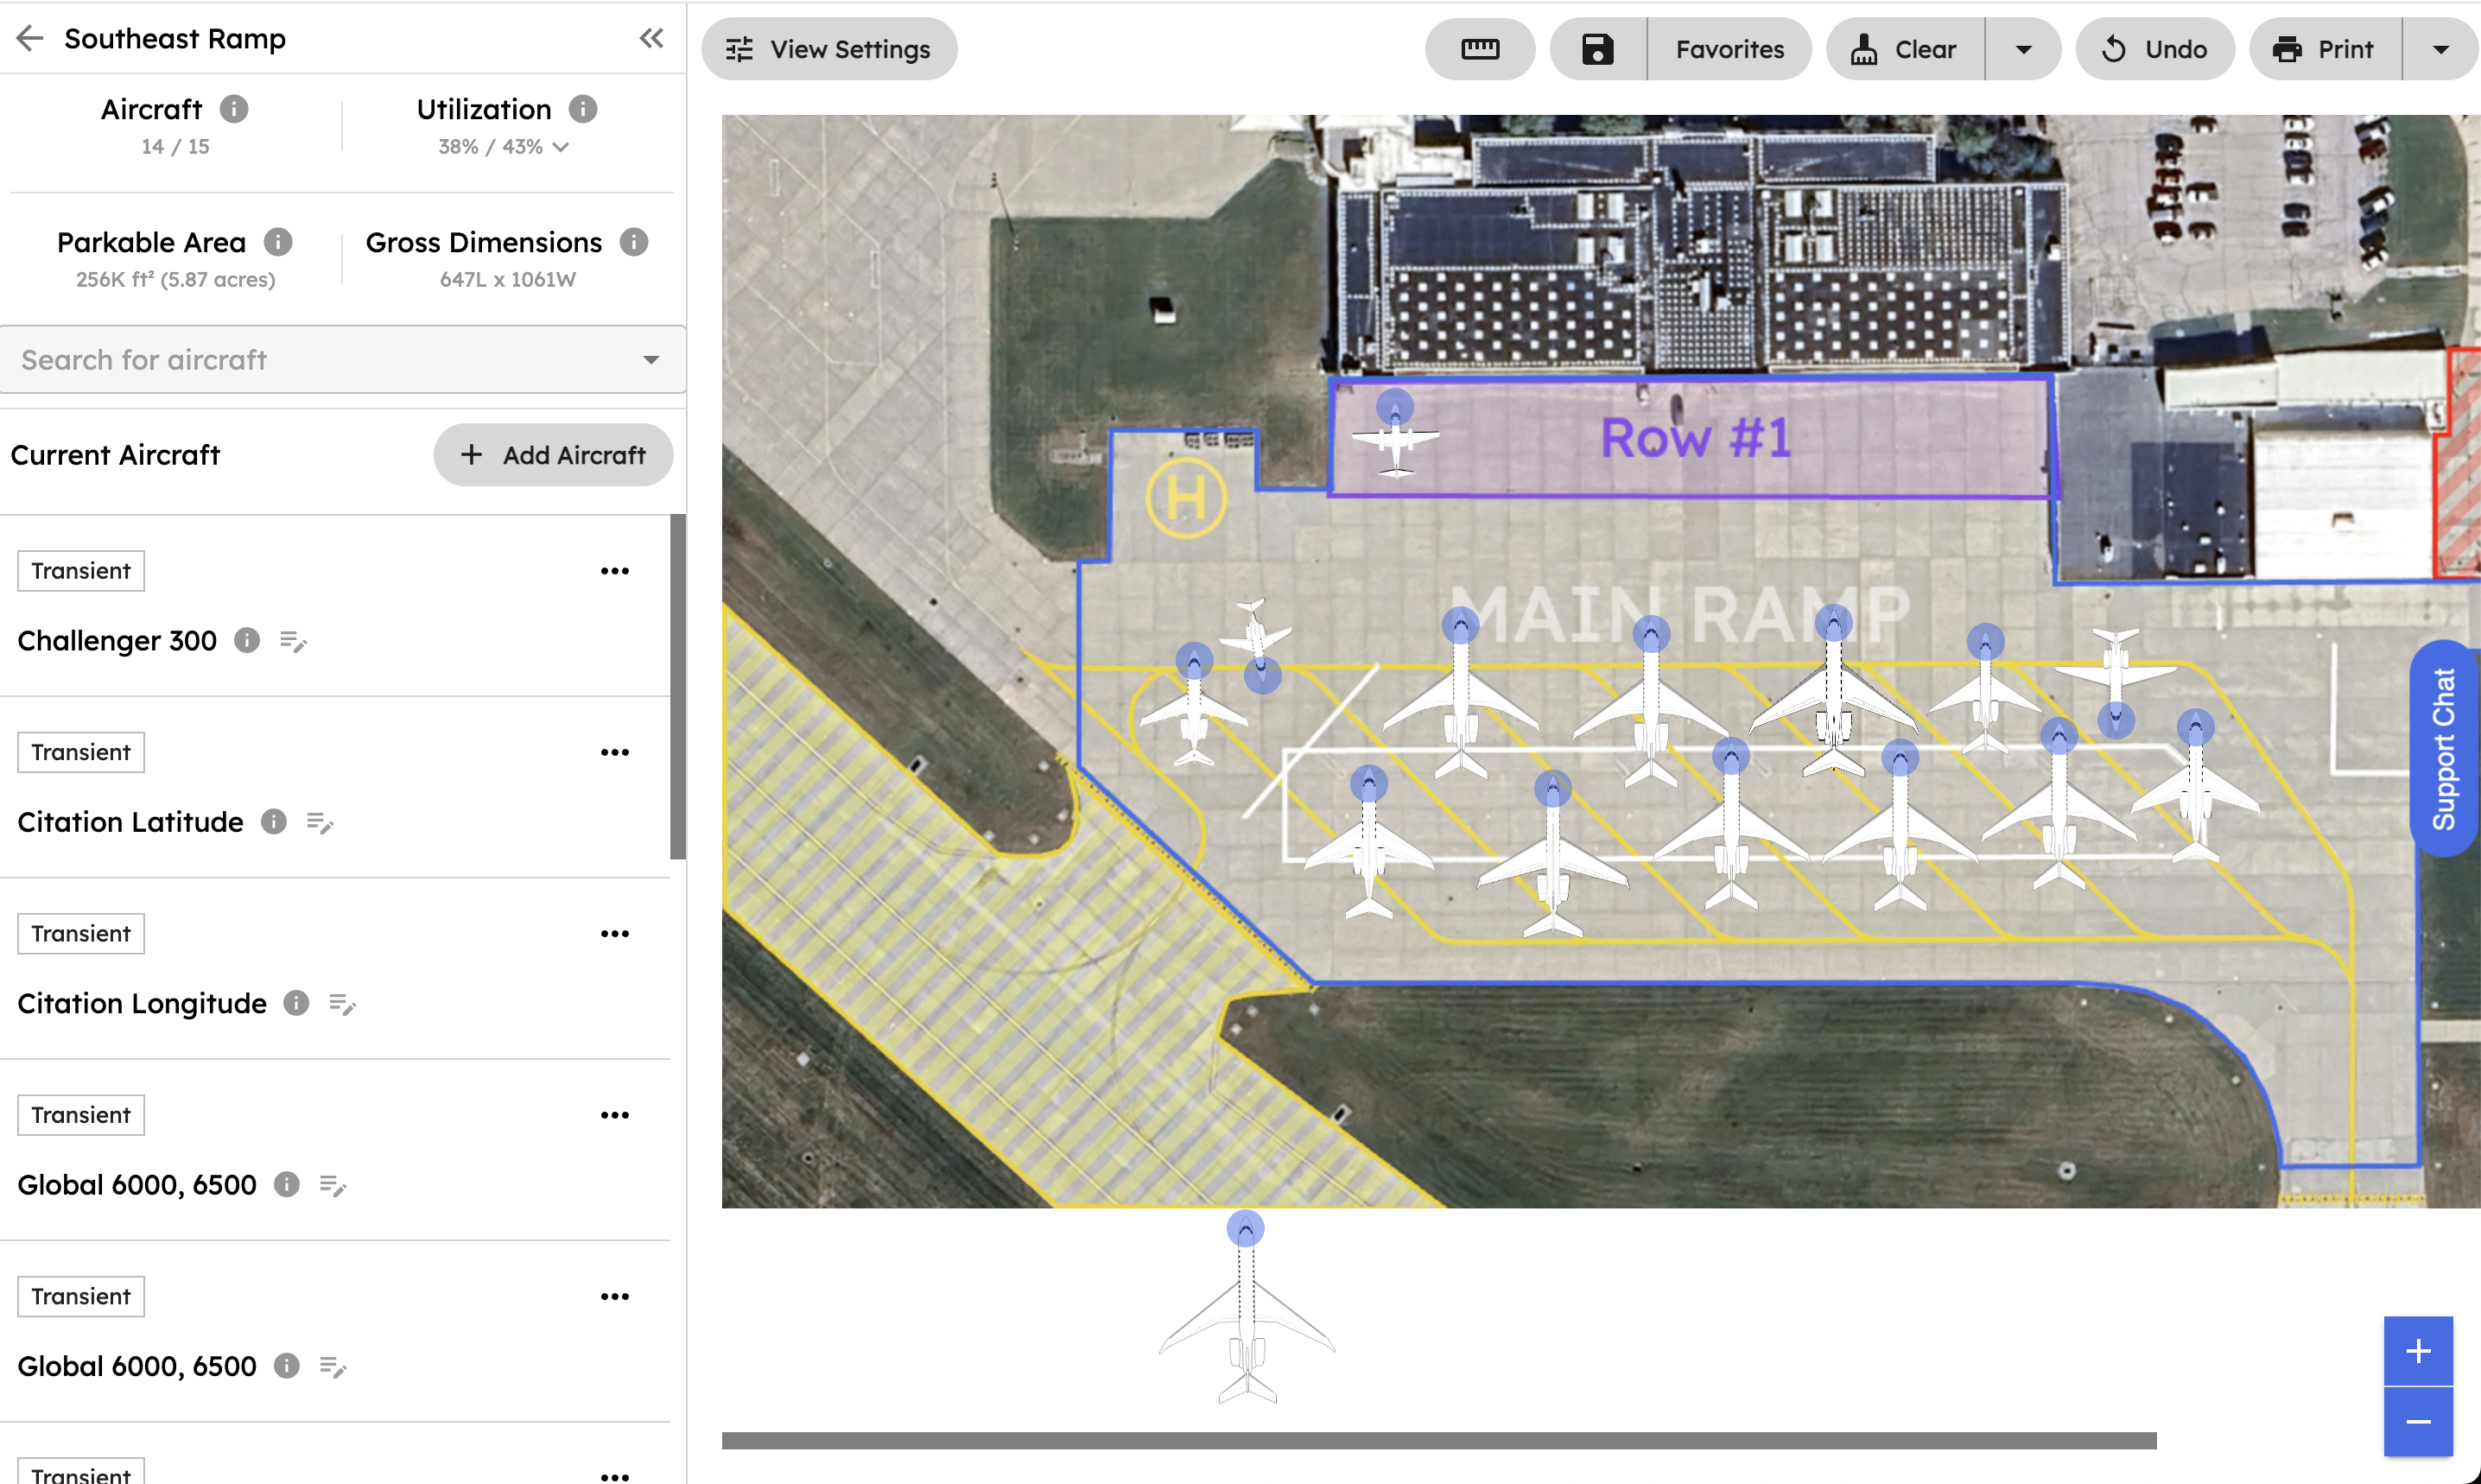 Real-time dashboards help FBO operators track occupancy and identify revenue opportunities
Step 3: Implement Dynamic Pricing Strategy
Hotels established this principle decades ago: peak demand commands premium pricing. Your ramp slots should operate similarly.
Peak Window Pricing
- Prime time fees: +20-50% during high-demand periods
- Off-peak discounts: -15-30% to stimulate utilization during slow periods
- Seasonal adjustments: Summer rates, winter incentives
Tiered Service Packages
Bundle ramp with value-added services:
- FastTurn Premium: Guaranteed sub-30 minute turn time + priority positioning
- Full Service: Ramp + fuel + lav + ground power + de-icing
- Overnight Premium: Covered parking + security + pre-flight prep
Minimum Guarantees for Based Aircraft
- Monthly minimum ramp spend or pre-paid credit plan
- 10-15% discount for annual pre-payment
- Guaranteed slot availability during peak periods
Step 4: Operational Improvements That Drive Revenue
Slot Reservation System
A shared calendar system improves upon first-come-first-served operations:
- Allow customers to reserve prime slots in advance
- Auto-release unconfirmed holds after 30 minutes
- Charge premium rates for guaranteed reservations
Turn-Time SLAs
Track and incentivize fast turnarounds:
- Target: Sub-30 minutes for transient aircraft
- Crew incentives: Bonus payments for meeting SLA targets
- Customer communication: Real-time updates on turn status
Layout Optimization
Reconfigure your ramp for maximum efficiency:
- Position fuel trucks for minimal taxi time
- Create dedicated lanes for different aircraft types
- Ensure ground power and equipment access doesn't block adjacent slots
Step 5: Technology Integration
Real-Time Operations Dashboard
Display current status and upcoming opportunities:
- Live occupancy rates by slot
- Incoming aircraft with ETA and service requirements
- Available slots for walk-in customers
Automated Notifications
Set up alerts for:
- Occupancy exceeding 80% (deploy surge pricing)
- Key customers inbound (prep premium service)
- Extended turns (investigate bottlenecks)
Billing Integration
Connect ramp management to your existing FBO software:
- Automatic invoicing based on slot usage
- Package pricing calculations
- Customer preference tracking
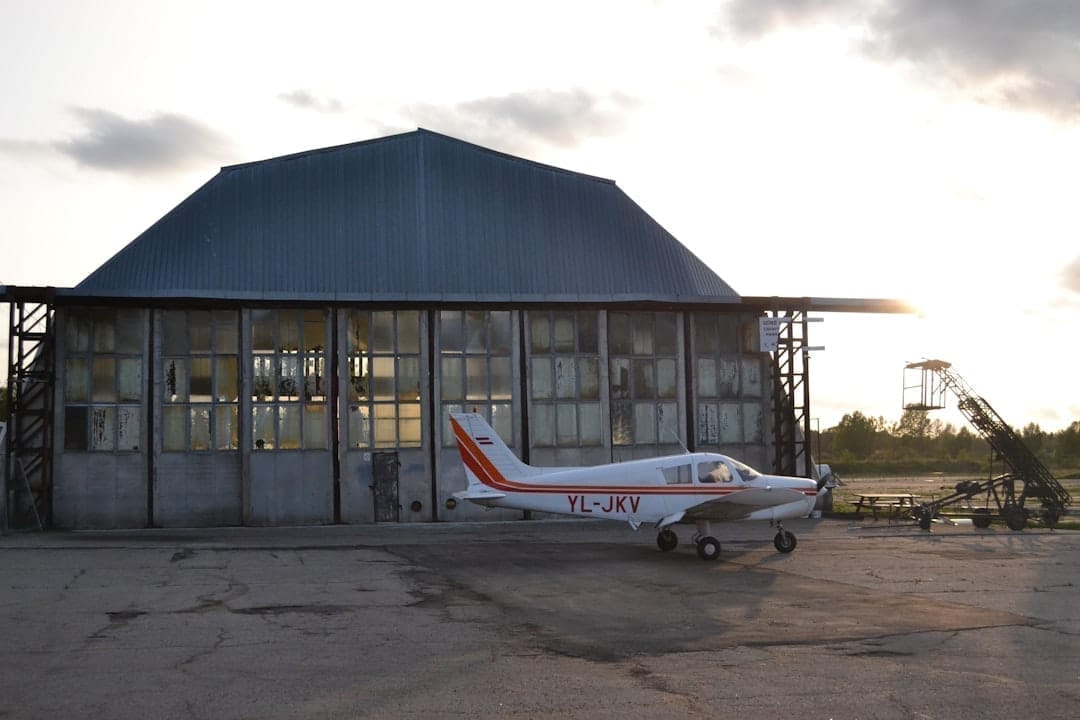
 Strategic aircraft positioning maximizes ramp efficiency and customer satisfaction
Step 6: Implementation Costs and Resource Requirements
Before diving into optimization, understand the investment required:
Initial Setup Costs
- Basic tracking system: $2,000-$5,000 for spreadsheet templates and simple software
- Reservation system: $5,000-$15,000 for basic calendar and booking integration
- Full ramp management platform: $20,000-$50,000 annually for comprehensive software
- Staff training: 20-40 hours across operations team ($2,000-$4,000 in labor costs)
Monthly Operating Costs
- Software licensing: $500-$2,000 monthly depending on features
- Additional staff time: 5-10 hours weekly for data analysis and optimization
- System maintenance: $200-$500 monthly for updates and support
Expected ROI Timeline
- Month 1-2: Baseline establishment and initial improvements (5-10% revenue increase)
- Month 3-6: Full system deployment and optimization (15-25% revenue increase)
- Month 6+: Ongoing refinement and peak performance (25-45% revenue increase)
Break-even analysis: Most FBOs see initial investment recovery within 60-90 days due to immediate utilization improvements.
Step 7: Run a Pilot Program
Don't overhaul everything at once. Test with a focused 30-day pilot:
Week 1: Baseline Measurement
- Track current occupancy and revenue per slot-hour
- Document existing turn times and customer complaints
- Establish your performance baseline
Week 2-3: Implement Dynamic Pricing
- Test peak-hour surcharge (start with +20%)
- Offer off-peak discount to fill slow periods
- Monitor customer response and adjust rates
Week 4: Add Reservation System
- Allow top 5 customers to book slots in advance
- Charge premium for guaranteed availability
- Track utilization of reserved vs. walk-in slots
Measure Results
- Δ in occupancy rate
- Δ in revenue per slot-hour
- Customer satisfaction scores
- Operational bottlenecks identified
Real-World Results
Case Study: Northeast Regional FBO (18 ramp slots, 45,000 annual operations)
Before optimization:
- Peak occupancy: 52%
- Average revenue per slot-hour: $18
- Turn times: 45 minutes average
- Monthly customer complaints: 8-12
After 90-day implementation:
- Peak occupancy: 78% (+50% improvement)
- Average revenue per slot-hour: $24 (+33% improvement)
- Turn times: 36 minutes average (-20% improvement)
- Monthly customer complaints: 3-5 (-60% improvement)
Financial Impact:
- Monthly ramp revenue increased from $28,000 to $42,000
- Annual additional revenue: $168,000
- Implementation cost: $35,000
- Net ROI: 380% in first year
Key success factors:
- Started with simple Excel tracking before investing in software
- Focused on 6-hour peak window (9am-3pm) for initial improvements
- Implemented peak pricing gradually (+15% first month, +25% by month 3)
- Used customer feedback to refine slot allocation algorithms
The key? They treated their ramp like the revenue center it is, not just a parking lot.
Technology Integration
Forward-thinking FBOs leverage hangar optimization platforms to enhance their ramp operations. Choosing the right aircraft tugs for efficient operations complements technology investments:
- Visual slot management reduces training time and eliminates positioning errors
- Real-time occupancy tracking enables dynamic pricing decisions
- Automated movement planning optimizes turn times and reduces ground traffic
- Mobile access keeps teams connected across all operational areas. Address staffing challenges with better training tools.
Your Next Step
The aviation industry is experiencing significant demand growth. The FAA's 2024-2044 Aerospace Forecast projects general aviation operations increasing 1.1% annually through 2044, with business aviation leading growth at 2.2% annually. FBOs that capture this growth will treat ramp operations as strategic revenue centers.
Start with measurement. Pick one metric from this playbook and begin tracking it this week. The data will reveal significant untapped revenue potential. Calculate your specific ROI to understand the financial impact.
Ready to transform your ramp operations into a profit center?
See How AirPlx Optimizes FBO Operations
Sources: Aviation Business Strategies Group 2024 FBO Survey, FAA 2024-2044 Aerospace Forecast, FAA Operations Network, NATA Industry Benchmarking Study 2024, International FBO Association Operational Guidelines, AIN 2024 FBO Americas Survey