The 7 Busiest Private Jet Airports in the United States (2024 Data)
Published on February 28, 2026 • 7 min read

Every FBO manager knows the feeling: it is 7 AM on a Monday, the ramp is at 110% capacity, and three more Gulfstreams just called inbound. At America's busiest private jet airports, that is not a bad week. That is a Tuesday.
The FAA's Business Jet Report tracks monthly operations at every airport in the country. Combined with departure data from PrivateJetCardComparisons, we can now rank exactly which airports handle the most private jet traffic, and by how much.
The Full Ranking: 2024 Private Jet Departures
| Rank | Airport | ICAO | 2024 Departures | Daily Avg |
|---|---|---|---|---|
| 1 | Teterboro, NJ | KTEB | 74,832 | ~205 |
| 2 | Palm Beach Intl, FL | KPBI | 41,967 | ~115 |
| 3 | Dallas Love Field, TX | KDAL | 40,332 | ~110 |
| 4 | Westchester County, NY | KHPN | 32,994 | ~90 |
| 5 | Van Nuys, CA | KVNY | 32,229 | ~88 |
| 6 | Harry Reid Intl, NV | KLAS | 31,765 | ~87 |
| 7 | Washington Dulles, VA | KIAD | 30,066 | ~82 |
Source: PrivateJetCardComparisons via DownBeach, based on 2024 departure data
Teterboro leads by a landslide. It records nearly double the departures of the second-place airport. The gap between #2 and #7 is tighter than most people expect.
1. Teterboro Airport (KTEB): The Undisputed King
Teterboro recorded 143,097 business jet flights in 2024, roughly 390 per day. Including all aircraft types, the airport handles approximately 177,000 total operations annually.
Sitting just 12 miles from Midtown Manhattan, Teterboro is the gateway for Wall Street, private equity, and anyone who needs to be in New York without dealing with JFK or LaGuardia. The airport enforces a 100,000-pound weight limit, which effectively bars commercial airliners and keeps the field dedicated to business aviation.
Three FBO operators compete fiercely for ramp space here: Jet Aviation, Signature Aviation (which acquired Meridian in early 2024 and now operates multiple terminals), and Atlantic Aviation. With 85% of all traffic being jets, every square foot of hangar and ramp is a battlefield.
The challenge? Teterboro sits in some of the most congested airspace in the world. The Port Authority manages 827 acres total, but only 90 acres are allocated to hangars and offices. That constraint means FBOs here live and die by how efficiently they can stack and shuffle aircraft.
At the busiest airports, finding an open ramp spot feels like parallel parking in Manhattan
2. Palm Beach International (KPBI): Snowbird Central
Palm Beach logged 41,967 private jet departures in 2024, a slight dip from prior years but still firmly in second place. The airport serves a unique mix: seasonal snowbirds from the Northeast, international traffic from Latin America and the Caribbean, and a growing base of full-time residents who relocated to Florida during the post-2020 migration wave.
Atlantic Aviation, Signature Aviation, and Jet Aviation all operate FBOs here. Peak season (November through April) creates brutal capacity crunches, with some weeks seeing 40-50% more traffic than summer months.
Worth noting: the Florida Legislature approved renaming the airport to President Donald J. Trump International Airport in February 2026, pending the governor's signature and FAA approval. Regardless of the name on the sign, the operational pressure stays the same.
3. Dallas Love Field (KDAL): Texas-Sized Traffic
Dallas Love Field recorded 40,332 private jet departures in 2024, putting it in a near-tie with Palm Beach. While Southwest Airlines dominates the commercial side (holding roughly 97% market share), the general aviation side thrives on Dallas' position as a headquarters city for energy, finance, and tech.
Love Field sits just 6 miles from downtown Dallas, giving it a major convenience advantage over DFW International for private flyers. Several full-service FBOs operate here, providing fuel, maintenance, hangar rentals, and charter services.
The big operational story: Love Field covers 1,300 acres with only two runways, meaning FBOs need to be exceptionally efficient with ground space to handle both Southwest's commercial volume and the constant flow of business jets.
4. Westchester County Airport (KHPN): The Quiet Powerhouse
Westchester logged 32,994 departures in 2024, moving up from sixth to fourth place in the national rankings. Located 33 miles north of Midtown Manhattan, KHPN serves as the preferred alternative for executives and residents in Westchester County, Connecticut's Fairfield County (Greenwich, Stamford), and the Hudson Valley.
The appeal is straightforward: shorter wait times, less congested airspace, and easier ground access compared to Teterboro. For anyone living north of the city, HPN saves an hour each way.
Million Air Westchester has consistently ranked among the top FBOs in the country in the AIN FBO Survey, and the airport's commercial service (872,023 passenger enplanements in 2019) means it maintains full Part 139 infrastructure that benefits GA operators too.
5. Van Nuys Airport (KVNY): Hollywood's Runway
Van Nuys recorded 32,229 private jet departures in 2024, but that only tells part of the story. The airport averages over 230,000 total takeoffs and landings annually, making it one of the busiest general aviation airports in the world, not just the country.
Clay Lacy Aviation, Castle & Cooke Aviation, Signature Flight Support, and Jet Aviation all operate FBOs here. Van Nuys has been the go-to for entertainment executives, production companies, and anyone in LA's tech corridor who needs flexible air access without the chaos of LAX.
Fun fact from earlier data: the Van Nuys-to-Teterboro route consistently ranks among the most-flown private jet routes in America. Basically a coast-to-coast shuttle for the people who run things.
 When every hangar bay is spoken for, the real competition is efficiency, not square footage
6. Harry Reid International (KLAS): Event-Driven Spikes
Las Vegas saw 31,765 private jet departures in 2024, a decline from prior years. But the averages mask the reality: traffic at KLAS is wildly uneven. During CES, the Super Bowl, major fight nights, or Formula 1, private jet traffic can more than double normal daily volumes.
That event-driven pattern creates a unique operational challenge. FBOs here need surge capacity that sits mostly idle during off-peak weeks. The economics only work if you can flex your hangar and ramp utilization up and down rapidly.
7. Washington Dulles (KIAD): The Capital Connection
Dulles rounded out the top 7 with 30,066 private jet departures in 2024. The airport serves the D.C. corridor, handling traffic tied to government, defense contractors, diplomatic missions, lobbying firms, and the multinational companies clustered in Northern Virginia.
Dulles has the infrastructure advantage of being designed for heavy international traffic, with customs, immigration, and the ability to handle widebody aircraft. For private operators needing global connectivity from the nation's capital, it is the default choice.
What These Airports Have in Common
Every airport on this list shares three traits:
1. Proximity to money. All seven sit within 30 minutes of a major business center. Teterboro has Wall Street. Van Nuys has Hollywood. Dallas Love has the energy sector. Private jet traffic tracks closely with regional wealth concentration.
2. Multiple competing FBOs. Competition drives service quality up and forces operators to invest in efficiency. Teterboro has three FBO operators fighting for market share across multiple terminals. That competition benefits customers but creates relentless pressure on operations teams.
3. Chronic capacity constraints. Not one of these airports has excess ramp or hangar space. Every single one turns away aircraft regularly, especially during peak periods. The economics of turning away even one jet per week add up to six figures annually in lost revenue.
Three Tactics the Busiest FBOs Use to Manage Capacity
Knowing the rankings is interesting. Knowing what to do about capacity on Monday morning is useful. Here are three specific tactics that high-volume FBOs deploy to squeeze more out of existing infrastructure.
Tactic 1: Departure-based stacking, not first-come parking. Most FBOs park aircraft in the order they arrive. Busy FBOs stack based on departure time. Aircraft leaving at 6 AM go near the doors. Overnights that are not moving until noon get tucked in the back with wings overlapping where vertical clearance allows. Based on our analysis, this can reduce morning repositioning moves by 40-60%. When you factor in the fully loaded cost of each tug operation (labor for a driver and wing walker, equipment wear, insurance liability), the savings add up quickly at a mid-size facility. It also cuts the average number of moves needed to extract a single aircraft from multiple repositions down to one or fewer.
Tactic 2: Seasonal staffing triggers tied to historical traffic data. Palm Beach sees 40-50% more traffic November through April. Las Vegas more than doubles its traffic during CES week. The FBOs that handle these surges without service breakdowns do not wait until the ramp is overflowing to call in extra staff. They build staffing calendars from prior-year traffic data, with trigger points (e.g., "when overnight count exceeds X, activate standby crew"). The alternative is paying 50% overtime premiums during peak periods, which is what most FBOs end up doing when they staff reactively.
Tactic 3: Real-time ramp visibility for the whole team. At a multi-terminal airport like Teterboro, the line crew, the ops desk, and the GM are often working from three different mental models of what the ramp looks like right now. The FBOs pulling ahead use shared digital layouts (whether that is software or a big screen in the ops room) so everyone sees the same picture. When a G650 calls inbound, the ops desk can confirm or deny hangar space in 30 seconds instead of radioing the ramp, waiting for a walkaround, and guessing. That speed difference is what separates "we can take you" from "try the FBO across the field."
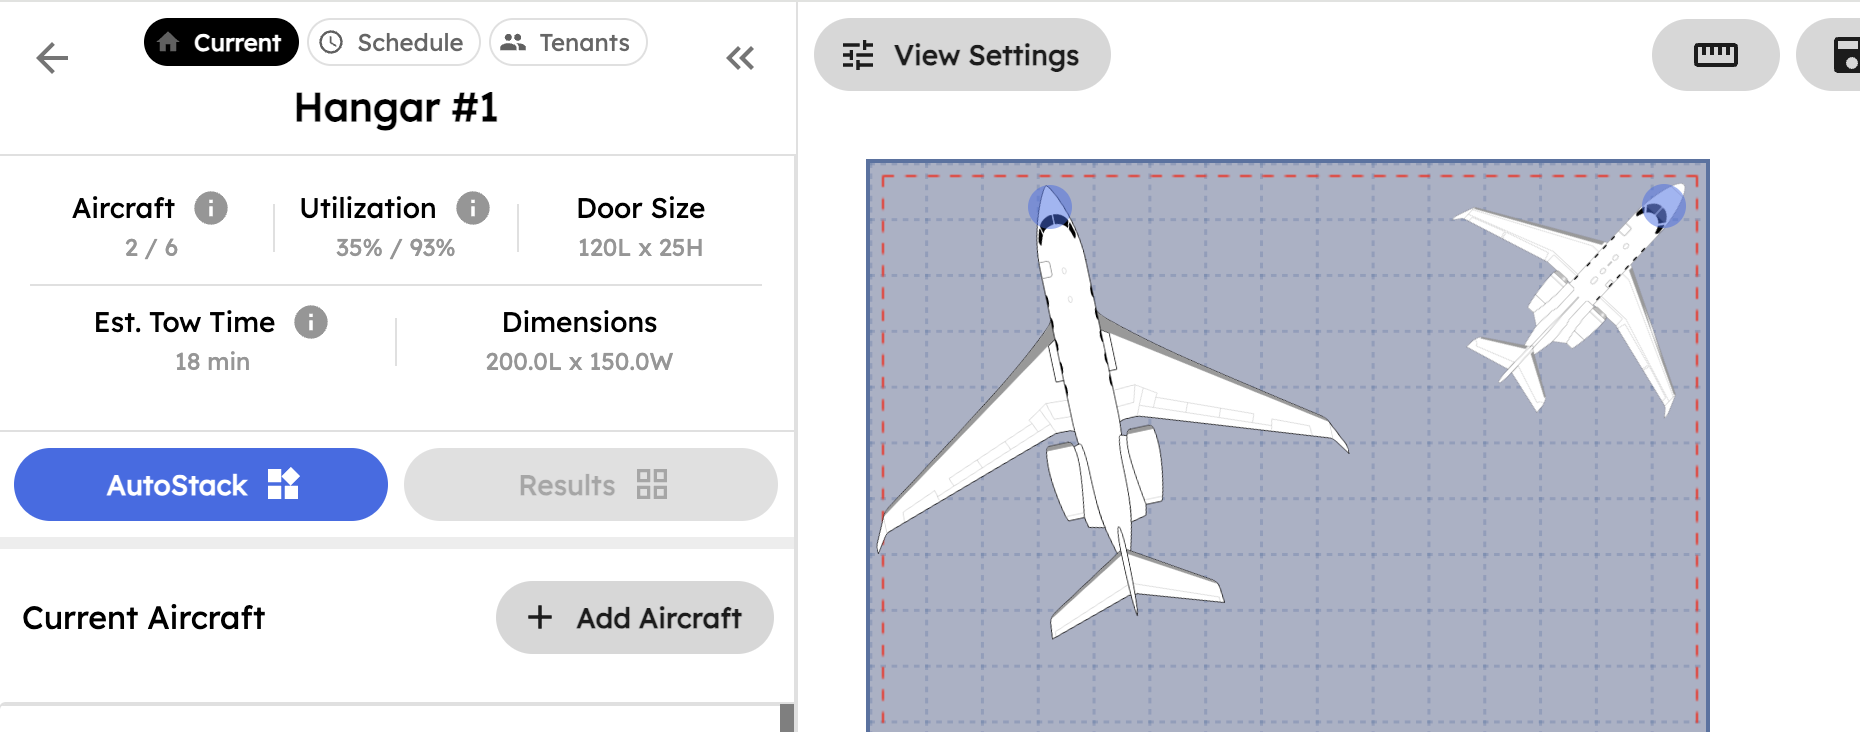
What Optimized Stacking Actually Looks Like
Talk about capacity improvement is cheap. Here is a concrete example.
We ran a simulation inside AirPlx modeled on a facility similar to what you would find at a busy Northeast airport: a 150x155 ft hangar with two 10 ft doors, standard 2 ft horizontal and 8 ft vertical spacing rules, and a mixed fleet ranging from Cessna singles to Gulfstream G450s.
Using 48 controlled layout experiments with the same aircraft mix and constraints, AirPlx tested 18 different stacking strategies per configuration. The results:
| Metric | Worst Case | Best Case | Average |
|---|---|---|---|
| Aircraft fitted | 7 | 10 | 9 |
| Utilization rate | 117% | 135% | 126% |
That "utilization over 100%" is not a typo. It means aircraft footprints overlap, with wings tucked under tails and noses staggered beneath higher fuselages. This is standard 3D stacking practice, and it is how the busiest FBOs fit aircraft that would otherwise be parked outside or turned away.
The practical impact: going from a worst-case 7-aircraft layout to an optimized 10-aircraft layout in the same hangar adds 3 additional aircraft per cycle. At $2,400 per mid-size jet visit (fuel, ramp fees, auxiliary services), that is an additional $7,200 per cycle. Run that math across peak-season weeks and you are looking at $200,000-350,000 in annual revenue from the same four walls.
 AirPlx tested 18 stacking strategies per hangar configuration. The difference between worst-case and best-case layouts in the same hangar was up to 3 aircraft.
The Capacity Problem Is Getting Worse
Here is the math that keeps FBO managers up at night: business jet operations at top airports surged post-pandemic but have plateaued since 2022, while hangar construction has not kept pace. You cannot build a new hangar in six months. Permitting, environmental review, and construction timelines mean 2-4 years minimum.
That gap between elevated demand and fixed supply means the FBOs that win will be the ones that squeeze more capacity out of existing infrastructure. A 20-25% improvement in hangar utilization at a top-tier FBO translates directly into hundreds of thousands in annual revenue, without pouring a single yard of new concrete.
The Bottom Line
The seven busiest private jet airports in America processed over 284,000 departures in 2024. That is 284,000 times an FBO had to find ramp space, schedule fuel, coordinate ground handling, and (hopefully) fit the aircraft in a hangar.
The airports at the top of this list did not get there by accident. They got there because of location, infrastructure investment, and relentless operational discipline. But even the best are bumping up against physical limits.
If you are running an FBO at a high-traffic airport (or want to become one), the question is not whether you will face capacity constraints. You already do. The question is whether you are managing that constraint with spreadsheets and radio calls, or with tools built for the job.
See what optimized hangar stacking looks like for your operation. Try the AirPlx ROI calculator to estimate how much revenue you are leaving on the ramp.
Sources:
- FAA Business Jet Report (monthly airport-level business jet operations data)
- 7 US Busiest Private Jet Airports, DownBeach (2024 departure rankings via PrivateJetCardComparisons)
- Teterboro Airport Overview, Business Airport International (143,097 business jet flights in 2024)
- Teterboro Airport, Wikipedia (airport specifications and operational data)
- Van Nuys Airport, Wikipedia (230,000+ annual operations)
- Palm Beach International Airport, Wikipedia (renaming legislation)
- Dallas Love Field, Wikipedia (airport specs, Southwest market share)