Stop Managing a $50M Airport with Spreadsheets and Windshield Surveys
It's 7:30 AM. Three transient G650s need overnight hangar space, a tenant FBO wants to expand their ramp footprint, and you have a city council meeting Thursday to justify Phase 2 construction. Open one dashboard, get answers in 5 minutes. AirPlx gives airport directors real-time utilization data across every hangar and ramp area so you can make capital decisions with evidence, not intuition.
Trusted by 100+ FBOs and airport operators across North America
100+
Airport & FBO Facilities
800+
Aircraft Models
1-2 Days
To Go Live
Same Day
Custom Facility Adds
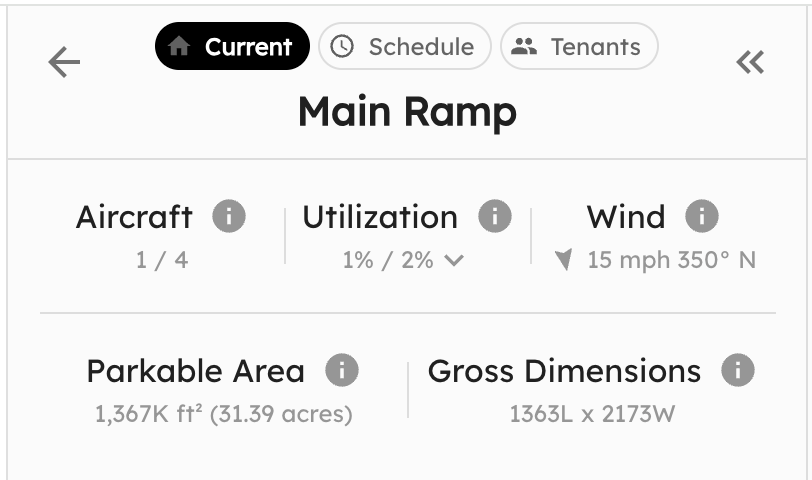
Replace the clipboard walk-around with a single airport-wide dashboard
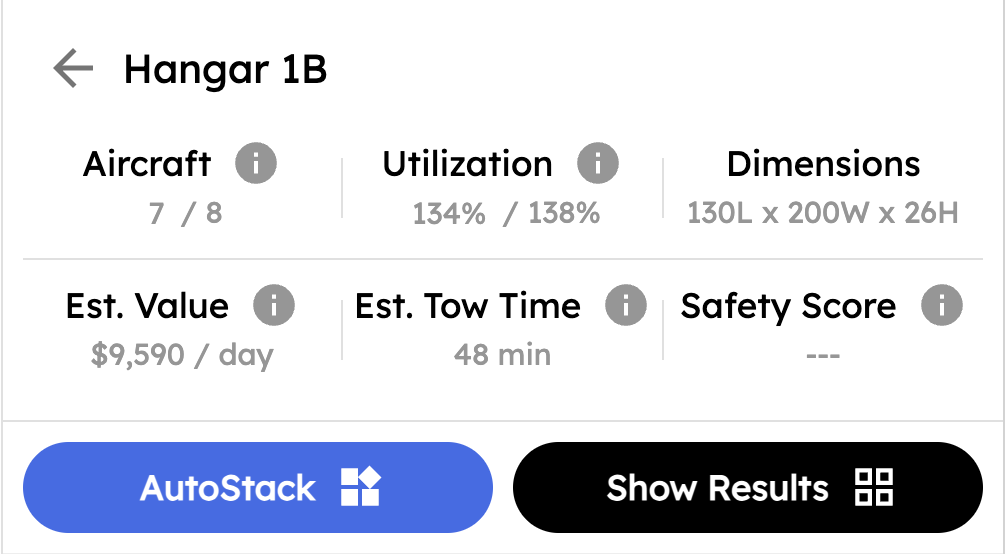
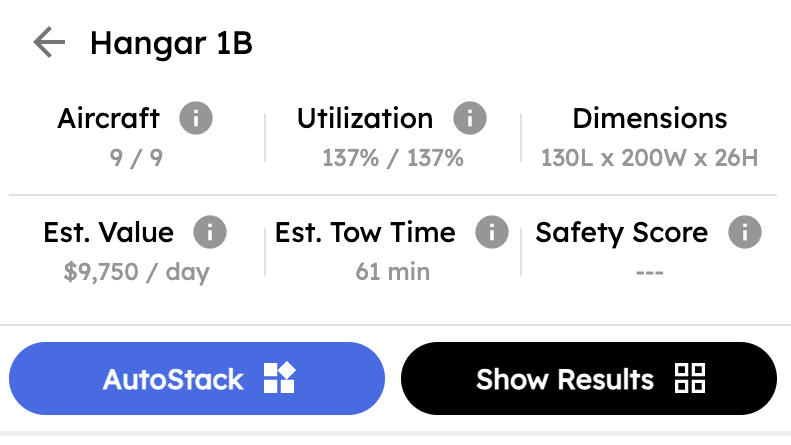
Right now, knowing your airport's true capacity means driving to each hangar, calling each FBO, and piecing together a picture in your head. AirPlx aggregates real-time utilization across every facility on your field into one view. See that Hangar 3 is at 92% while Hangar 7 sits half-empty. Identify 15,000 sq ft of unused capacity you didn't know existed. When the board asks 'Are we full?', answer with a number instead of a shrug.
Test a $12M hangar project before spending a dollar on architects
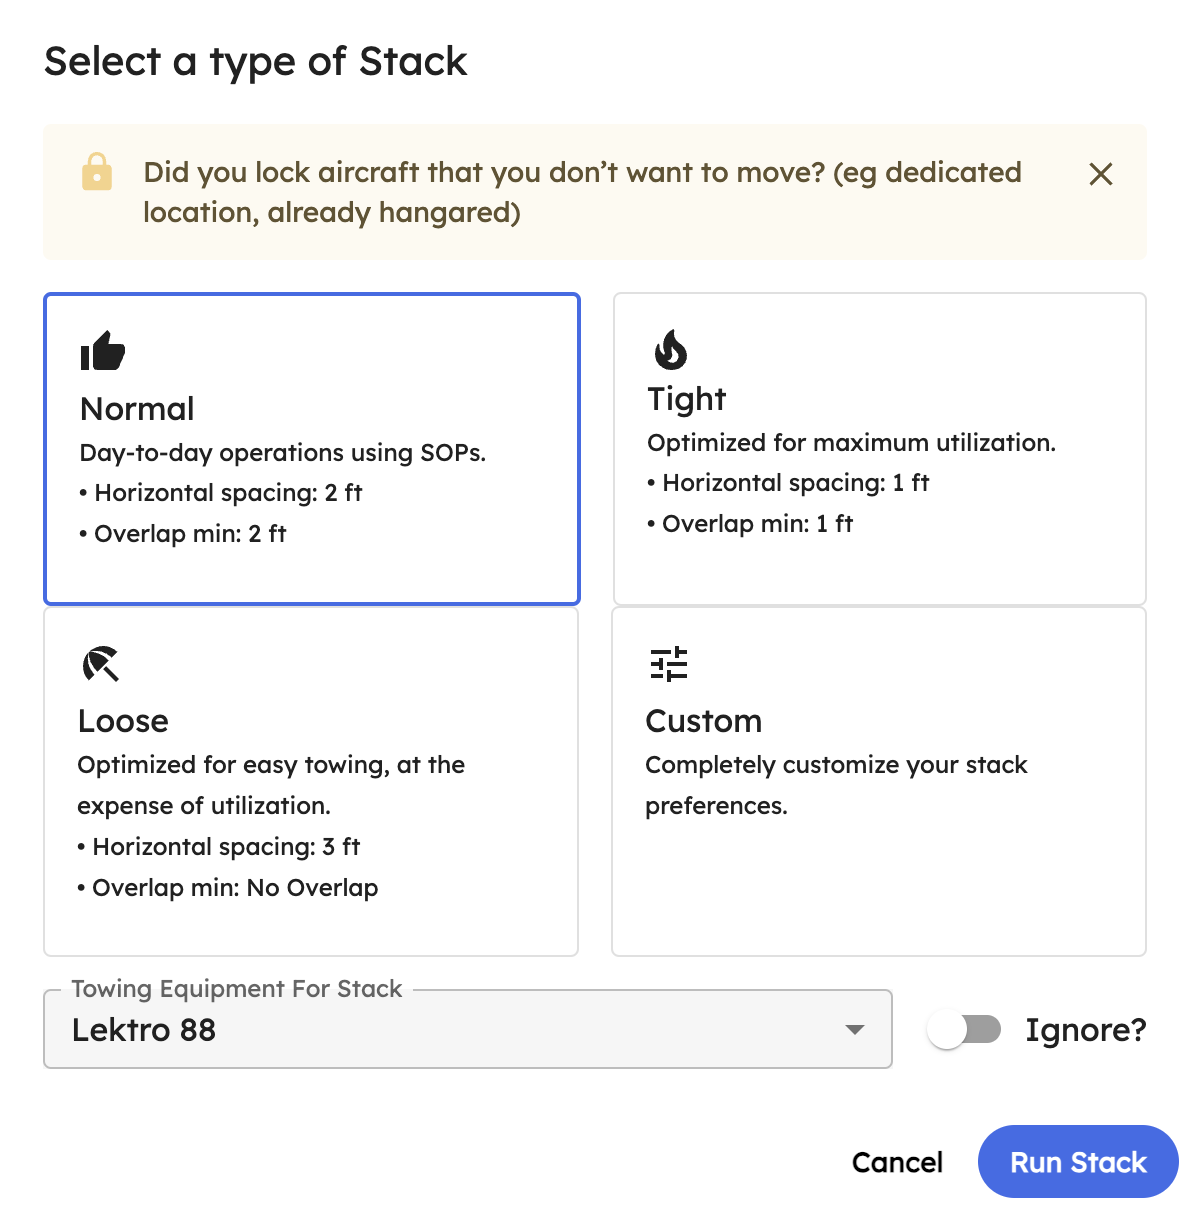
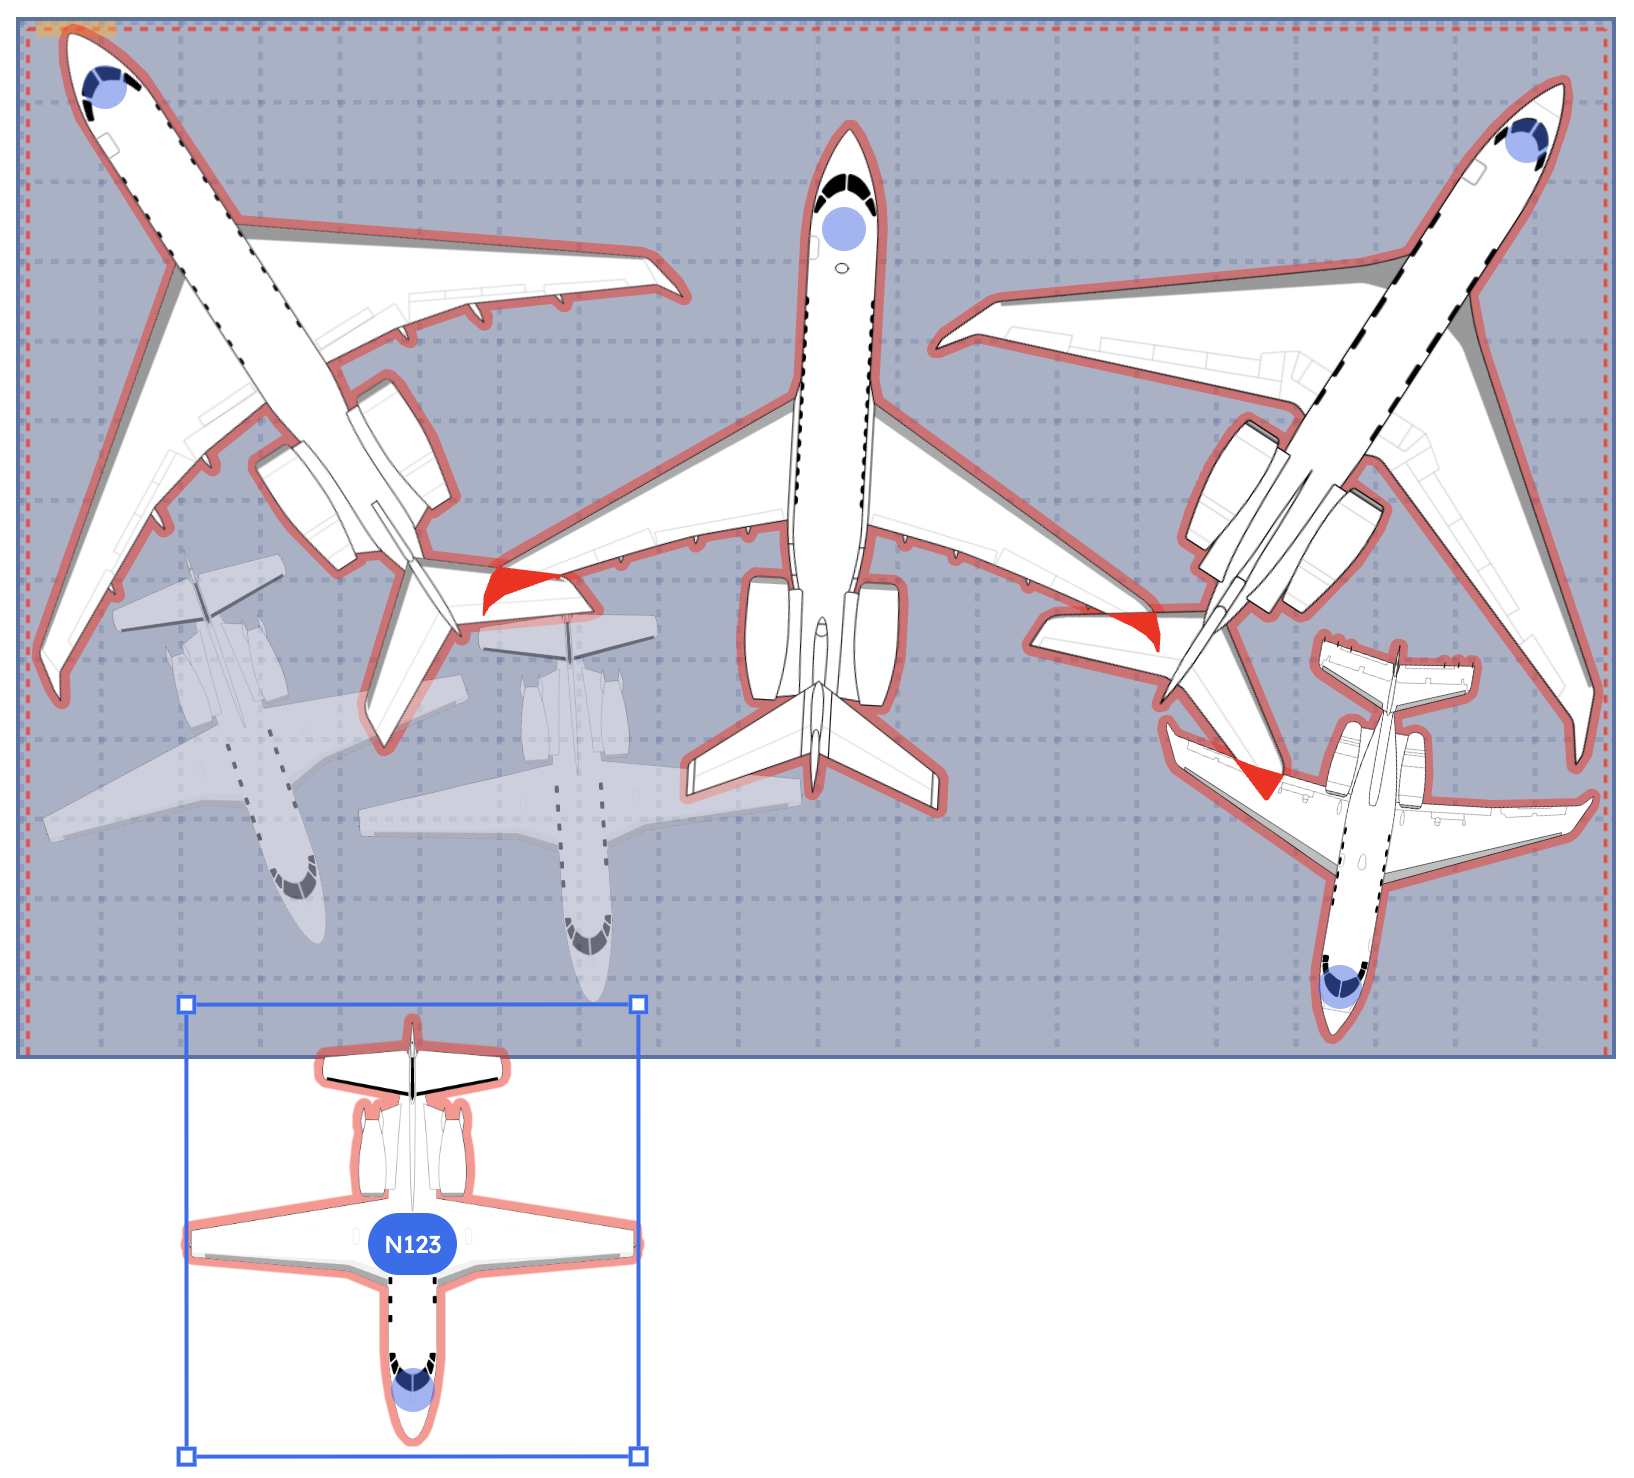
Drop a proposed 30,000 sq ft hangar into your airport layout and instantly see how many aircraft it accommodates. Test door widths, column placements, and configurations before committing to architectural plans. Model your actual fleet mix — the Challengers, Globals, and G700s your tenants fly today — and see exactly how many fit. Walk into the city council meeting with a 3D rendering that shows the proposed facility at 85% utilization on day one, not a PowerPoint with bullet points.
Negotiate tenant leases with utilization data, not guesswork
Your FBO tenants tell you they need more ramp space. But are they fully using what they already have? AirPlx gives you the utilization numbers to answer that question definitively. See that Tenant A uses their hangar at 60% on weekdays while Tenant B turns away aircraft because they are at 98%. Restructure lease terms based on actual usage. Allocate expansion rights to operators who have demonstrated demand. When a tenant disputes their assessment, pull up 6 months of timestamped utilization data instead of debating anecdotes.
Give your board and city council the data they actually need
Airport directors answer to boards, city councils, and FAA grant requirements. AirPlx replaces the quarterly narrative report ('we think we are getting busier') with hard utilization numbers: average hangar occupancy hit 87% in Q3, up from 71% year-over-year. Peak ramp demand exceeded capacity 14 times last month. Projected fleet mix growth requires 40,000 additional sq ft by 2028. When you are requesting $15M in bond financing for a new hangar complex, these are the numbers that get projects approved.
"Since we started using AirPlx, our nightly hangar revenue is up just over 10%. If we fit two more airplanes in a night, we've paid for AirPlx for a year."
Jon Zelie
General Manager
Jet Aviation Milwaukee
Frequently asked questions
Common questions from airport directors and authorities about capacity planning
Is this for airport authorities or individual FBOs?
Both, and that's the key advantage. Airport directors get a facility-level dashboard showing utilization across every hangar and ramp area on the field. FBO tenants use AirPlx for daily aircraft placement and scheduling. The data flows up automatically — you get real-time visibility into how your facilities are being used without asking tenants for reports or walking the field yourself.
Why can't we just keep using spreadsheets and drive the field?
You can, but you are making million-dollar capital decisions with thousand-dollar data. Spreadsheets capture a snapshot that is outdated the moment you save the file. Walking the field tells you what is happening right now, not what happened last Tuesday at 4 PM or how occupancy trended over the past 6 months. AirPlx captures utilization continuously across every facility, giving you trend data, seasonal patterns, and peak analysis that no spreadsheet or windshield survey can provide. When the city council asks 'How do you know we need this hangar?', a timestamped utilization history is categorically different from 'I drove the field and it looked full.'
How does this help with new hangar construction decisions?
Model your current aircraft mix in potential new hangar dimensions before breaking ground. Drop actual aircraft types — the G650s, Globals, and Challengers your tenants fly — into a proposed 30,000 sq ft footprint and see exactly how many fit. Test different door widths and column placements. Compare a 200x150 layout against a 250x120 layout with the same square footage. See which one handles more aircraft given your actual fleet mix. You will know whether to build before you spend a dollar on architectural drawings.
Can we use the data for tenant lease negotiations?
Absolutely — this is one of the highest-value use cases for airport directors. Pull up any tenant's utilization history and see exactly how they are using their allocated space. If a tenant claims they need an additional 10,000 sq ft of ramp, you can verify whether they are fully utilizing their current allocation. If another tenant consistently operates at 95%+ capacity, you have the data to justify prioritizing their expansion request. Lease renewal conversations become fact-based instead of adversarial.
How quickly can we get our airport set up?
Most airports are fully operational within 1-2 days. We model your hangars and ramp areas from facility drawings or satellite imagery, load the aircraft database (800+ models pre-loaded), and train your team. If you need additional facilities or custom configurations added, those are typically done same-day.
What kind of reporting can we generate for board meetings?
AirPlx provides utilization data that translates directly into the metrics boards and city councils care about: average occupancy rates by facility, peak demand frequency, year-over-year utilization trends, and projected capacity shortfalls based on fleet mix growth. Instead of presenting a narrative report, you present hard numbers that justify capital expenditure requests and demonstrate return on existing facility investments.
What airports currently use AirPlx?
AirPlx is used at airports ranging from single-FBO regional fields to major metropolitan airports with multiple operators and complex tenant structures. We work with both municipal airports and airport authorities. Contact us for references relevant to your operation size and governance structure.
See your actual airport layout modeled in AirPlx
We will model your hangars and ramp areas from your facility drawings. You will see real utilization data across your entire airport within 48 hours. No spreadsheets. No windshield surveys. Just the numbers you need to run your airport.